Open access

Establishing reference ranges for lymphocyte proliferation responses to phytohemagglutinin in patients with T cell dysfunction

Publication: LymphoSign Journal
25 February 2019

Abstract

Introduction: The evaluation of lymphocyte proliferation responses is a critical component of the clinical work up for patients with suspected immunodeficiencies. Those with severe combined immunodeficiency (SCID) have consistently low to absent responses (stimulation index, SI) to the mitogen phytohemagglutinin (PHA). However, patients with combined immunodeficiency (CID) have more varied proliferative responses, and are open to a wide range of interpretations.
Aims: To establish lymphocyte proliferation response reference ranges for patients with T cell defects, especially those with CID as well as healthy controls.
Methods: Data was collected retrospectively from charts of patients with a diagnosis of SCID (n = 39), CID (n = 52), or from healthy controls (n = 440). Reference percentiles were calculated using the 95% of the distribution of the test results.
Results: The reference ranges for the control group ranged from 134 to 2220.5, whereas those with CID were distributed between 0.81 and 169.1. Patients with typical SCID had profound low proliferative responses, with SI <5.
Conclusion: Our results highlight the variability of lymphocyte proliferation responses to PHA in patients with CID as well as healthy controls. These reference ranges will assist with the critical interpretation of assay results, particularly when values fall on the extreme end of the range.
Statement of novelty: We provide reference ranges for lymphocyte proliferation responses to PHA from patients with CID and healthy controls.

Introduction

Mitogens, such as phytohemagglutinin (PHA), are plant lectins that are potent inducers of T cell proliferation (Nowell 1960). These non-specific stimuli activate the surface glycoprotein of T cell receptors and initiate intracellular signaling, ultimately triggering cell division (Sharon and Lis 2004).
For decades, assessment of lymphocyte proliferation has been a useful tool in the diagnosis of severe combined immunodeficiency (SCID). Patients with SCID invariably have low to absent responses to PHA (Roifman et al. 2012). However, in patients with combined immunodeficiency (CID), the results of these tests have not been standardized and are open to a wide range of interpretations (Roifman et al. 2012). Moreover, despite its use for over 50 years, there are currently no established reference ranges and the interpretation of test results is based upon comparison to healthy controls. This introduces multiple limitations, including variability associated with individual control samples, challenges of recruiting volunteers, and the additional labour associated with assaying control samples.
Given that the number of newly discovered CIDs continues to expand, improved interpretation of lymphocyte proliferation responses to mitogens, such as PHA, would aid in identifying such disorders.
In this study, we collected retrospective data of lymphocyte proliferation responses to PHA from 39 patients with SCID, 52 patients with CID, as well as 440 healthy controls. Our primary goal was to establish reference ranges for patients with T cell defects, especially in those with CID. Importantly, identification of the gene defect associated with these T cell disorders has allowed, for the first time, critical analysis of mitogen responses in the corresponding conditions. We have subsequently studied in a prospective manner the validity of these reference ranges in patients with SCID or CID.

Methods

Patients

Retrospective analysis

This cohort included patients who were diagnosed with SCID or CID who had a genetic diagnosis at the Hospital for Sick Children between 1990 and 2016. CID refers to patients who had lymphocyte counts of more than 500 cells/μL (Roifman et al. 2012), which is consistent with the definition provided by the International Union of Immunological Societies (Bousfiha et al. 2015). Informed consent (REB Protocol No. 1000005598) was obtained from parents and (or) patients as well as from healthy adult volunteers, and included consent for genetic analysis. Results of in vitro T lymphocyte proliferation responses to PHA were collected from charts of 39 patients with SCID, 52 patients with CID, and 440 healthy controls. The 39 patients with SCID had mutations in the following genes: ADA (n = 14), IL-2Rγc (n = 13), IL-7Ra (n = 4), CD3 delta (n = 3), DNA Ligase-4 (n = 2), JAK3 (n = 1), RAG1 (n = 1), and RAG2 (n = 1). Patients with CID had confirmed IL-2Rγc deficiency and maternal engraftment or leaky autologous cells (n = 8), Omenn’s syndrome (n = 10), Zap-70 deficiency (n = 6), partial ADA deficiency (n = 2), mutations in RMRP gene (n = 3), MHC class II deficiency (n = 3), Rel-B deficiency (n = 2), coronin 1A deficiency (n = 1), IL-2Ra deficiency (n = 1), or unknown genetic defects (n = 16).

Mitogen proliferation assay

Lymphocyte proliferation responses to PHA were determined by 3H-thymidine incorporation using the microtiter plate technique (Arpaia et al. 1994). In principle, the radioactive nucleotide thymidine is incorporated into DNA as cells enter the S phase of the cell cycle. The amount of 3H-thymidine detected in cells stimulated with PHA is then divided by 3H-thymidine detected in unstimulated cells (background), and the result is termed the stimulation index (SI) (Dean et al. 1977). In our assay, 5 × 104 lymphocytes are plated, and subsequently activated and pulsed with 10 μg/mL PHA and 1 μCi 3H-thymidine, respectively. A latent period of 3 days is observed before the lymphocytes start to proliferate (Nowell 1960). All assays were performed in triplicate and were compared with those simultaneously performed on normal controls.

Statistics

Reference percentiles for proliferation of T lymphocytes to PHA were calculated from healthy control, CID, and SCID groups, using the central 95% of the distribution of test results (lower limit: 2.5 percentile, upper limit: 97.5 percentile). 95% confidence intervals for the 2.5 and 97.5 percentiles were calculated around each of these limits.

Results

Lymphocyte proliferation responses to PHA

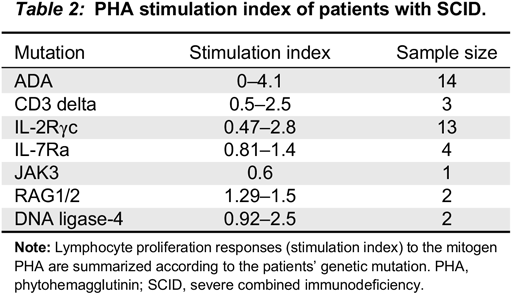
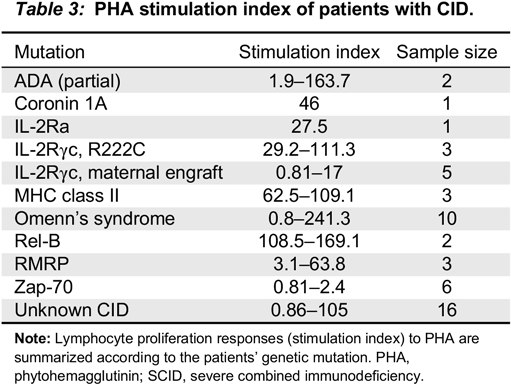
The SI reference percentiles (Table 1) for the control group (n = 440) ranged from 134 to 2220.5 (lower and upper limits, respectively), reflecting the inherent variability of samples from healthy individuals. In agreement with previous studies (Buckley et al. 1997; Roifman et al. 2012), patients with SCID (n = 39) had universally low T lymphocyte responses to PHA, with SI reference percentiles ranging from 0 to 4.1. Analysis of the SI from 52 patients with CID confirms the partial function of T cells, with the reference percentiles ranging between 0.81 and 169.1. A summary of the SI from patients with SCID or CID are shown in Tables 2 and 3, respectively. In the CID cohort, 51 of 52 patients had an SI of <200. Patients with IL-2Rγc deficiency and maternal engraftment had SI of 0–30, patients with Omenn’s syndrome had SI of 0–20, except for 1 patient with an SI of 241. We found that 61% of CID patients had SI below 20 (71% with an SI <40, 78% with an SI <60, 86.6% SI <100). In 6 patients with Zap-70 deficiency, SI results were in the range of SCID, 0–5 (all <3). One patient with partial ADA deficiency had a SI of 1.9 and the second patient had a SI of 163. A patient with IL-2Ra deficiency had a SI of 21–30. One patient with RMRP mutation had a SI of 0–5, and the 2 others had SI of 51–100. Three patients with R222C mutations had SI: 29, 86, and 111. Three patients with MHC class II deficiency had SI: 62, 86, and 109. A patient with coronin 1A deficiency had SI of 46. Two patients with Rel-B mutations had SI of 101–150. 16 patients with CID of unknown molecular diagnoses had SI ranging from 0 to 150.
Table 1:
Table 1: Reference ranges for lymphocyte proliferation responses to PHA.

Note: Percentiles were calculated using the central 95% of the distribution of test results (lower limit: 2.5 percentile, upper limit: 97.5 percentile). 95% confidence intervals for the 2.5 and 97.5 percentiles were calculated around each of these limits (shown in the last 2 columns). CID, combined immunodeficiency; PHA, phytohemagglutinin; SCID, severe combined immunodeficiency; SI, stimulation index; p, percentile.

Table 2:
Table 2: PHA stimulation index of patients with SCID.

Note: Lymphocyte proliferation responses (stimulation index) to the mitogen PHA are summarized according to the patients’ genetic mutation. PHA, phytohemagglutinin; SCID, severe combined immunodeficiency.

Table 3:
Table 3: PHA stimulation index of patients with CID.

Note: Lymphocyte proliferation responses (stimulation index) to PHA are summarized according to the patients’ genetic mutation. PHA, phytohemagglutinin; SCID, severe combined immunodeficiency.

Discussion

Different centres have adopted varied methods for interpreting results of lymphocyte proliferation responses. Some have used an arbitrary threshold of counts from 3H-thymidine incorporation to distinguish normal from abnormal response, with most setting up side-by-side patient and normal control samples to be used as comparators. Regardless of the method used, they were all accurate in detecting typical SCID samples which were almost invariably extremely low. However, with the expanding recognition of a wide spectrum of T cell immunodeficiencies (CID), this type of analysis has posed increasing challenges in defining abnormal responses to mitogens.
One solution adopted by many centres was to arbitrarily define a response as normal if the patients’ lymphocyte stimulation index exceeded 50% of control. We found this method often times inadequate because of the great variability in single samples obtained from control and normal individuals.
In our study, SI of healthy controls ranged from 134 to 2220.5, demonstrating the wide range of the results of this test. Importantly, this highlights the issue of interpreting patients’ results based on direct comparison to single samples. For example, a patient who is evaluated but doesn’t have intrinsic T cell defects and has a normal SI can be interpreted as abnormal if the control is in the upper range; hence, the patient SI might be <50% of the control. This may lead to a false positive result. The opposite is also possible, where if the control SI is very low, a patient with an intrinsic T cell defect but an SI above 50% of that control might be interpreted as normal, which could result in a false negative result.
There are groups of CIDs that could have normal lymphocyte enumeration, for example NEMO mutation with immunodeficiency (Orange et al. 2004), R222C mutations in IL-2Rγc (Somech and Roifman 2005), and Rel-B deficiency (Merico et al. 2015), but abnormal mitogen proliferation results. This test therefore becomes important in increasing the suspicion of CID. Furthermore, the results of this study help to establish the SI of healthy controls and assists in the critical interpretation of control values, especially when their SI is at the extreme end of the “normal” range.
In our cohort, all the patients with typical SCID had profound low proliferative responses, with SI <5, consistent with previous studies (Buckley et al. 1997; Roifman et al. 2012). Patients with non-typical SCID, Omenn’s syndrome or patients with maternal T cell engraftment had very low SI, yet somewhat higher than typical SCID (SI 0–30).
Remarkably, almost all patients with CID (98%) had SI of <200 and almost 85% had SI <100. Patients with Zap-70 deficiency (n = 6) had profoundly low mitogen responses, indistinguishable from SCID. The 2 patients with partial ADA had wide differences in their mitogen response. The first patient had a SI of 1.9 while the second had a SI of 163. PHA responses in cases with cartilage hair hypoplasia were variable, ranging from 5 to 100. Patients with MHC class II deficiency had SI well within the range of CID, unlike previous publications suggesting that these might have normal mitogen responses, but absent antigen responses (Al-Mousa et al. 2010). This is a good example of the advantage of using our analysis to define normal ranges rather than assaying single samples. The lower SI in MHC class II deficiency might be related to the decreased numbers of CD4+ cells, which contribute to about two-thirds of the T cell population as well as disturbed co-stimulatory molecules that play an important role in mitogen proliferation (Bonilla 2008). In a similar manner, patients with CID due to Rel-B, CD25, coronin 1A and others have all consistently had PHA levels below 200.
It is notable that some CIDs may present with normal proliferative responses against PHA, but not other mitogens, such as CD3/CD28. For example, loss-of-function mutations in caspase recruitment domain family, member 11 (Stepensky et al. 2013) result in aberrant NFκB signaling and hypogammaglobulinemia. However, PHA proliferative responses are preserved. Thus, it should be kept in mind that no single laboratory test can identify or define impaired cellular immunity, and all tests should be interpreted with due caution and correlated with clinical context.
Recently, alternative techniques to assess T cell proliferation have been offered. One method is to track lymphocyte division using the fluorescent dye carboxyfluorescein diacetate succinimidyl ester (CFSE), developed by Lyons and Parish (1994). With this method, the CFSE dye is diluted by half with each cell division until it becomes undetectable (Quah et al. 2007). Another method uses 5-ethynyl-2′-deoxyuridine (EdU), a fluorescent nucleoside analogue, which directly measures de novo DNA synthesis. EdU incorporates into the DNA of dividing cells using click chemistry and the fluorescence emitted serves as an index of cell proliferation (Yu et al. 2009). The latter method seems to correlate better to 3H-thymidine when studied in mice (Yu et al. 2009). The disadvantages of these assays include increased cost, dependence on expensive and complex equipment, and more importantly, the lack of proper control ranges for CID. Studies that compare flow cytometry based assays with 3H-thymidine will aid in defining the advantages and limitations of these assays.

REFERENCES

Al-Mousa H., Al-Shammari Z., Al-Ghonaium A., Al-Dhekri H., Al-Muhsen S., Al-Saud B., Arnaout R., Al-Seraihy A., Al-Jefri A., Al-Ahmari A., Ayas M., and El-Solh H. 2010. Allogeneic stem cell transplantation using myeloablative and reduced-intensity conditioning in patients with major histocompatibility complex class II deficiency. Biol. Blood Marrow Transplant. 16:818–823.
Arpaia E., Shahar M., Dadi H., Cohen A., and Roifman C.M. 1994. Defective T cell receptor signaling and CD8+ thymic selection in humans lacking zap-70 kinase. Cell. 76:947–958.
Bonilla F.A. 2008. Interpretation of lymphocyte proliferation tests. Ann. Allergy Asthma Immunol. 101:101–104.
Bousfiha A., Jeddane L., Al-Herz W., Ailal F., Casanova J.L., Chatila T., Conley M.E., Cunningham-Rundles C., Etzioni A., Franco J.L., Gaspar H.B., Holland S.M., Klein C., Nonoyama S., Ochs H.D., Oksenhendler E., Picard C., Puck J.M., Sullivan K.E., and Tang M.L. 2015. The 2015 IUIS Phenotypic Classification for Primary Immunodeficiencies. J. Clin. Immunol. 35:727–738.
Buckley R.H., Schiff R.I., Schiff S.E., Markert M.L., Williams L.W., Harville T.O., Roberts J.L., and Puck J.M. 1997. Human severe combined immunodeficiency: Genetic, phenotypic, and functional diversity in one hundred eight infants. J. Pediatr. 130:378–387.
Dean J.H., Connor R., Herberman R.B., Silva J., Mccoy J.L., and Oldham R.K. 1977. The relative proliferation index as a more sensitive parameter for evaluating lymphoproliferative responses of cancer patients to mitogens and alloantigens. Int. J. Cancer. 20:359–370.
Lyons A.B. and Parish C.R. 1994. Determination of lymphocyte division by flow cytometry. J. Immunol. Methods. 171:131–137.
Merico D., Sharfe N., Hu P., Herbrick J.-A., and Roifman C.M. 2015. RelB deficiency causes combined immunodeficiency. LymphoSign J. 2:147–155.
Nowell P.C. 1960. Phytohemagglutinin: An initiator of mitosis in cultures of normal human leukocytes. Cancer Res. 20:462–466.
Orange J.S., Jain A., Ballas Z.K., Schneider L.C., Geha R.S., and Bonilla F.A. 2004. The presentation and natural history of immunodeficiency caused by nuclear factor κB essential modulator mutation. J. Allergy Clin. Immunol. 113:725–733.
Quah B.J., Warren H.S., and Parish C.R. 2007. Monitoring lymphocyte proliferation in vitro and in vivo with the intracellular fluorescent dye carboxyfluorescein diacetate succinimidyl ester. Nat. Protoc. 2:2049–2056.
Roifman C.M., Somech R., Kavadas F., Pires L., Nahum A., Dalal I., and Grunebaum E. 2012. Defining combined immunodeficiency. J. Allergy Clin. Immunol. 130:177–183.
Sharon N. and Lis H. 2004. History of lectins: From hemagglutinins to biological recognition molecules. Glycobiology. 14:53R–62R.
Somech R. and Roifman C.M. 2005. Mutation analysis should be performed to rule out γc deficiency in children with functional severe combined immune deficiency despite apparently normal immunologic tests. J. Pediatr. 147:555–557.
Stepensky P., Keller B., Buchta M., Kienzler A.K., Elpeleg O., Somech R., Cohen S., Shachar I., Miosge L.A., Schlesier M., Fuchs I., Enders A., Eibel H., Grimbacher B., and Warnatz K. 2013. Deficiency of caspase recruitment domain family, member 11 (CARD11), causes profound combined immunodeficiency in human subjects. J. Allergy Clin. Immunol. 131:477–485.e1.
Yu Y., Arora A., Min W., Roifman C.M., and Grunebaum E. 2009. EdU-Click iT flow cytometry assay as an alternative to [3H]thymidine for measuring proliferation of human and mice T lymphocytes. J. Allergy Clin. Immunol. 123:S87.

Information & Authors

Information

Published In

cover image LymphoSign Journal
LymphoSign Journal
Volume 6Number 1March 2019
Pages: 26 - 30

History

Received: 18 January 2019
Accepted: 20 February 2019
Accepted manuscript online: 25 February 2019

Authors

Affiliations

Mohammad Alsalamah [email protected]
Division of Immunology and Allergy, Department of Paediatrics, The Hospital for Sick Children, University of Toronto, Toronto, ON
The Canadian Centre for Primary Immunodeficiency and The Jeffrey Modell Research Laboratory for the Diagnosis of Primary Immunodeficiency, The Hospital for Sick Children, Toronto, ON
Linda Vong
Division of Immunology and Allergy, Department of Paediatrics, The Hospital for Sick Children, University of Toronto, Toronto, ON
The Canadian Centre for Primary Immunodeficiency and The Jeffrey Modell Research Laboratory for the Diagnosis of Primary Immunodeficiency, The Hospital for Sick Children, Toronto, ON
Lorand Cimpean
Division of Immunology and Allergy, Department of Paediatrics, The Hospital for Sick Children, University of Toronto, Toronto, ON
The Canadian Centre for Primary Immunodeficiency and The Jeffrey Modell Research Laboratory for the Diagnosis of Primary Immunodeficiency, The Hospital for Sick Children, Toronto, ON
Harjit Dadi
Division of Immunology and Allergy, Department of Paediatrics, The Hospital for Sick Children, University of Toronto, Toronto, ON
The Canadian Centre for Primary Immunodeficiency and The Jeffrey Modell Research Laboratory for the Diagnosis of Primary Immunodeficiency, The Hospital for Sick Children, Toronto, ON

Metrics & Citations

Metrics

Other Metrics

Citations

Cite As

Export Citations

If you have the appropriate software installed, you can download article citation data to the citation manager of your choice. Simply select your manager software from the list below and click Download.

Cited by

1. A novel STAT3 splice-site variant in a kindred with autosomal dominant hyper IgE syndrome

View Options

View options

PDF

View PDF

Get Access

Login options

Check if you access through your login credentials or your institution to get full access on this article.

Subscribe

Click on the button below to subscribe to LymphoSign Journal

Purchase options

Purchase this article to get full access to it.

Restore your content access

Enter your email address to restore your content access:

Note: This functionality works only for purchases done as a guest. If you already have an account, log in to access the content to which you are entitled.

Media

Media

Other

Tables

Share Options

Share

Share the article link

Share on social media