Tandem mass spectrometric determination of purine metabolites and adenosine deaminase activity for newborn screening of ADA–SCID
Abstract
Background: Screening newborns for severe combined immunodeficiency (SCID) aims for early identification and treatment of the affected newborns. Adenosine deaminase (ADA) deficiency, a defect in the purine metabolic pathway, is a major cause of SCID and is characterized by the accumulation of adenosine (Ado) and deoxyadenosine (dAdo) in dried blood spots (DBSs). If left untreated, infants with this disorder are at risk of life-threatening infections. Analysis of T-cell receptor excision circles (TRECs) in DBS samples is the gold-standard screening method. However, TREC analysis is insufficient to determine SCID etiology, and a fraction of ADA–SCID may not be detected.
Methods: We used the original DBS screening sample to measure Ado, dAdo, and ADA activity. Erythro-9-(2-hydroxy-3-nonyl) adenine was used as an ADA inhibitor to imitate ADA deficiency, making it possible to create quality control material with pathological enzyme activity and metabolite levels. Quantification was achieved by tandem mass spectrometric analysis with a run time of 2.5 min.
Results: The 95th percentile reference intervals (n = 588) of Ado and dAdo were 0.9–3.0 and 0.1–0.4 µmol/L, respectively. The 95th percentile reference interval (n = 200) of ADA activity using 13C10, 15N5 Ado and 15N5 dAdo as substrates were 0.8–1.6 and 0.4–0.7 pmol/DBS, respectively. In confirmed ADA patients (n = 4), Ado and dAdo were significantly elevated, whereas ADA activity was almost absent.
Conclusion: These novel methods are applied, in our lab, to samples with low TRECs, with no false negative or false positives encountered to date. The potential of using these methods as a primary screening approach for ADA–SCID is in the process of validation.
Statement of novelty: New mass spectrometric methods to simultaneously measure adenosine, deoxyadenosine, guanosine, and deoxguanosine, as well as ADA activity in neonatal DBS samples have been developed. This methodology highlights the metabolic nature of ADA–SCID and complements TREC analysis by providing additional biochemical information.
Introduction
Screening newborns for severe combined immunodeficiency (SCID) aims at identifying the affected newborns before the appearance of symptoms. Adenosine deaminase (ADA) deficiency is a rare autosomal recessive disorder of the purine salvage pathway, characterized by the accumulation of adenosine (Ado), deoxyadenosine (dAdo), and deoxyadenosine triphosphate (dATP). Elevations of Ado, dAdo, and dATP that occur in ADA deficiency cause systemic metabolic toxicity. This impairs the immune system and results in several nonimmune abnormalities affecting hepatic, renal, and neurological systems. ADA patients usually present in infancy with SCID as a result of a defective immune system (Hershfield and Mitchell 2001; van den Berghe et al. 2006; Nyhan 2009; Sauer et al. 2012). SCID, which is characterized by the impairment of cell-mediated and humoral immunity, encompasses a heterogeneous group of rare disorders, and represents the severe end of the combined immunodeficiency spectrum (Hershfield and Mitchell 2001; van den Berghe et al. 2006; Nyhan 2009; Notarangelo 2010). In ADA–SCID, unlike other causes of SCID, the cytotoxic effect of accumulating ADA substrates affects various lymphocyte subtypes and leads to T-cell, B-cell, and natural killer cell lymphopenia (Kelly et al. 2013). The overall prevalence of SCID is 1:50 000–1:100 000 live births with ADA–SCID being the second most prevalent form of SCID, accounting for 20% of cases (Gaspar et al. 2009; Puck 2011; Verbsky et al. 2012; Kelly et al. 2013; Pai et al. 2014). Infants born with SCID appear normal at birth. However, these patients are at high risk of early-onset life-threatening infections (Notarangelo 2013). The mainstay treatment for SCID in general and ADA–SCID in particular is hematopoietic stem cell transplantation. ADA–SCID may also be treated with other therapeutic modalities including enzyme replacement and gene therapy (Gaspar et al. 2009). A favourable outcome is anticipated should treatment start before symptoms appear, with a higher survival rate observed in those who received transplants at or before 3.5 months of age (Pai et al. 2014).
Since 2008, a growing number of newborn screening programs have successfully implemented population-based screening for SCID (Puck 2011; Verbsky et al. 2012; Kwan et al. 2013; Vogel et al. 2014). The addition of this disorder as a primary target at Newborn Screening Ontario was recently approved by the Ministry of Health and Long Term Care, making Ontario the first Canadian province to offer this test. In a newborn screening laboratory setting, quantitative analysis of T-cell receptor excision circles (TRECs) in dried blood spots (DBSs) is the gold-standard screening method (Puck 2012). However, TREC analysis alone is insufficient to determine the exact cause of SCID. This is problematic because early identification and detoxification of metabolites are likely vital to improving outcome for infants with ADA–SCID.
Second-tier testing, whereby a more specific marker is measured in the original sample, is an efficient way to improve the screening specificity and this approach has been adopted by several newborn screening laboratories (Janzen et al 2007; Matern et al. 2007). Owing to the inability of the assay for TRECs to provide information about Ado and dAdo, which are present at elevated levels in patients with ADA deficiency, another method of analysis for these compounds in DBS specimens is warranted. These markers were detected in DBS by tandem mass spectrometry (MS–MS) and were shown to considerably improve newborn screening for ADA–SCID by introducing an etiologic focus (Azzari et al 2011; la Marca et al. 2014a).
Here we present a novel MS–MS method to detect Ado, dAdo, guanosine (Guo), and deoxyguanosine (dGuo), collectively referred to as purine metabolites, in DBSs. This method utilizes a simple sample preparation and allows for the detection of these metabolites in a single 3.2 mm disc. We also describe a procedure to measure ADA activity in DBSs using stable isotopes as substrates. In our laboratory, these methods are applied to DBS specimens with low TREC counts. This additional information undoubtedly narrows down the differential diagnosis considerably, and may expedite the diagnostic workup and treatment.
Methods
Chemicals and standard solutions
Ado, dAdo, Guo, and dGuo were supplied by Sigma–Aldrich (St. Louis, Missouri, USA). We used 13C5 Ado, 13C10, 15N5 Ado, 15N5 dAdo, 15N5 Guo, and 15N5 dGuo as internal standards (IS), and they were purchased from Cambridge Isotope Laboratories (Andover, Maryland, USA). LC–MS grade acetonitrile and LC–MS grade methanol were from Burdick’s and Jackson (Muskegon, Michigan, USA). LC–MS grade formic acid was purchased from Fisher Scientific (Fair Lawn, New Jersey, USA). Erythro-9-(2-hydroxy–3-nonyl) adenine (EHNA) was from Sigma–Aldrich. Water was obtained from a Direct-Q 5 UV-R Ultrapure water system (Millipore S.A.S., Molsheim, France). All other reagents were of analytical grade or better.
Individual solutions of purines and labelled IS at a concentration of 1.0 mg/mL were prepared by dissolving proper amounts of standard material in water for Ado, dAdo, and dGuo; in 50% methanol for 13C5 Ado, 15N5 dAdo, and 15N5 dGuo; and in ammonium hydroxide (10 mmol/L) for Guo and 15N5 Guo. A mixture (0.1 mmol/L) of 13C5 Ado, 15N5 dAdo, 15N5 Guo, and 15N5 dGuo was prepared in 50% methanol and was further diluted in the same solvent to produce the intermediate IS solution at1.0 µmol/L. These solutions are stable for at least 6 months when stored at −20 °C in the dark. The IS solution, at a concentration of 0.1 µmol/L, is freshly prepared daily by diluting the intermediate IS solution 10-fold in 70% methanol.
Control and patient DBS samples
Our Institutional Research Ethics Board at the Children’s Hospital of Eastern Ontario, Ottawa, Ontario, approved this study. Anonymized, archived DBS samples from the Ontario Newborn Screening laboratory, which produced normal profiles for all screened conditions, were used to determine the reference ranges for purines (n = 588) and ADA activity (n = 200). These samples are collected in general at 24–72 h. Archived DBS specimens from confirmed ADA patients (n = 4) were also analyzed. These samples were stored at ambient temperature under dry conditions for 80, 53, 52, and 0.25 months. Archived DBS controls stored for periods matching those of ADA patients’ samples were simultaneously analyzed to assess the effect of storage time on purine concentrations and ADA activities.
Sample preparation for purine measurements
We added 100 µL of daily IS solution to a single 3.2 mm DBS disc that was placed in a designated well of a 96-well plate, and the plate was sealed with a sealing film (Platemax; Axygen Scientific). After 15 min of incubation with shaking (37 °C, 650 rpm) 90 µL of eluates were transferred to a 96-well Nunc plate (Thermo Scientific) and evaporated to dryness under vacuum (60 °C, 45 min). The residue was reconstituted in 90 µL of 0.1% formic acid in 70% acetonitrile by shaking for 10 min at 27 °C. Aliquots (7.5 µL) of the resultant solution were injected into the MS–MS system.
Determination of ADA enzyme activity
A 3.2 mm DBS sample was punched into the designated well of a 96-multiwell filter plate (Pall Corp, Ann Arbor, Michigan, USA) and eluted using 120 µL of water by shaking at 650 rpm (24 °C for 30 min). After filtration under vacuum, two 40 µL portions of the eluate were dispensed into two 2 mL microtubes (Axygen, Union City, California, USA) and were labelled “Test” and “Blank”. Ten microlitres of 10 µmol/L of EHNA in water were added to the Test tubes, whereas 10 µL of water were added to Blank tubes. The tubes were vortexed for 10 s and allowed to sit at room temperature for 5 min. Fifty microlitres of 2 mmol/L ammonium acetate containing 1.0 µmol/L of 13C10, 15N5 Ado, and 15N5 dAdo were added to each tube as ADA substrates. The mixture was incubated at 37 °C with shaking (20 rpm). After 30 min, the enzymatic reaction was stopped by adding 400 µL of acetonitrile containing 13C5 Ado (0.125 µmol/L), and the mixture was vortexed for 30 s. After evaporation to dryness using a vacufuge for 55 min at 60 °C, the residue was reconstituted in 125 µL of water containing 0.1% formic acid, and 3 µL of this mixture was injected into the MS–MS system to measure residual 13C10, 15N5 Ado, and 15N5 dAdo using 13C5 Ado as the IS. The enzyme activity, expressed in picomoles of residual substrate per DBS, was measured by calculating the difference in 13C10, 15N5 Ado, and 15N5 dAdo in the test and blank tubes after the enzymatic reaction.
MS–MS system
Analysis of the purines in the DBSs was performed on a Xevo XE MS–MS system (Micromass, Manchester, UK) coupled with a Waters ACQUITY Ultra Performance LC system (Waters, Milford, Massachusetts, USA) for solvent delivery and sample introduction. MassLynx software (version 4.1) running under the Microsoft Windows XP professional environment was used to control the instruments and for data acquisition.
The electrospray ionization source (ESI) was operated in the positive ion mode using a capillary and cone voltage of 3.0 kV and 29 V, respectively, with a collision energy of 10 eV using argon as the collision gas. Ion source and desolvation temperatures were maintained at 120 and 400 °C, respectively. Scanning was in the multiple reaction monitoring (MRM) mode using transitions of mass to charge (m/z) of 268 to 136 for Ado; 273 to 136 for 13C5 Ado; 283 to 146 for 13C10,15N5 Ado; 252 to 141 for dAdo; 257 to 136 for 15N5 dAdo; 284 to 152 for Guo; 289 to 157 for 15N5 Guo; 268 to 152 for dGuo; and 273 to 157 for 15N5 dGuo; all transitions had a dwell time of 0.03 s.
Samples were introduced to the ion source using 70% acetonitrile containing 0.1% formic acid as the mobile phase. The flow-rate gradient was programmed to start at 140 µL/min then drop to 10 µL/min after 0.2 min. At 1.21 min, the flow was increased to 500 µL/min. This surge in flow at the end of data acquisition serves to clear any residual material and to decrease the background noise. Injection-to-injection time was set at 2.5 min.
Method development and validation
Extraction of purines was optimized using aqueous–organic mixtures at various proportions. Extraction time was investigated using 70% methanol for various time periods. Linear ranges were determined using calibrators prepared with standard purine solutions diluted in 0.9% NaCl (Baxter, Mississauga, Ontario) in the range 0.1–100 µmol/L. Quality control (QC) materials at physiological and pathological purine levels were prepared using whole blood with or without EHNA treatment at a concentration of 10 µmol/L. Calibrators and QCs were applied manually onto Whatman 903™ Specimen Collection Paper and allowed to dry at ambient temperature overnight. Dried calibrators and QC samples were stored at 20 °C in sealed plastic bags with a desiccant.
Within-day (n = 12) and between-day (n = 12) variations were evaluated by repeatedly analyzing QC materials at levels representing normal and abnormal concentrations. The coefficient of variation (CV%) was calculated according to the following equation: [CV% = (100 × standard deviation)/mean]. Analytical recovery was calculated using data obtained from DBS specimens as follows: [Recovery% = 100 × (concentration measured/concentration added)].
The stability of purine metabolites in DBS was assessed by storing spiked samples (5 and 25 µmol/L) at various temperatures (ambient, –20 °C, and 30 °C). Analyses were carried out as described over a period of 5 weeks.
ADA activity assay conditions were determined by monitoring the enzyme reaction (up to 60 min), substrate concentration (1–10 µmol/L), EHNA concentration (2.5–160 µmol/L), and incubation temperature (30–60 °C). Within-day (n = 20) and between-day (n = 20) reproducibility of ADA activity analysis were assessed by repeatedly analyzing normal and EHNA-treated DBS specimens.
Results
MS/MS experiments
Individual solutions containing purine metabolites and the IS were infused into the first quadrupole of the MS–MS. Positive ion-mode ESI-MS scanning revealed intense ions at m/z of 268, 252, 284, and 268, corresponding to the [MH]+ of Ado, dAdo, Guo, and dGuo, respectively. Subsequent transmission of these ions into the collision cell, followed by scanning using the second resolving quadrupole for fragments, revealed a common fragmentation pattern corresponding to the cleavage of the glycosidic C–N bond. Intense fragments produced from Ado and dAdo were assigned to protonated adenine (m/z of 136), whereas those from Guo and dGuo were assigned to protonated guanine (m/z of 152). Figure 1 shows the product ion spectra and fragmentation pattern of Ado at an m/z of 268 (Figure 1A) and dAdo at an m/z of 252 (Figure 1B).
Figure 1:

Chromatographic separation was not required in this work, and samples were introduced into the MS–MS using a flow-injection analysis method. This was achieved using a gradient program that changes the flow rate of 70% (v/v) acetonitrile containing 0.1% formic acid between 10 and 500 µL/min over the course of the run to maximize the sensitivity. The use of a flow surge at the end of each run reduced ion suppression and enhanced the peak shape. The analytical time between successive injections was 2.5 min.
Sample preparation for purine measurements
DBS calibrators could not be prepared in this work, owing to residual ADA activity that persisted after traditional enzyme deactivation treatments such as freeze–thaw cycles or heating whole blood at 45 °C for 24 h. We added EHNA, a specific ADA inhibitor to whole blood, to prevent the deamination of Ado and dAdo to inosine and deoxyinosine, respectively. Purine metabolites were extracted from 3.2 mm dried calibrators or DBS specimens using an aqueous solution of 70% methanol (v/v) containing isotope-labelled IS. This solution was added directly into a 96-well plate containing the samples and incubated at 37 °C with shaking (650 rpm). The extraction yield reached its maximum at ≥15 min. The following experiments were therefore performed at 37 °C for 15 min. Purine metabolites were stable for at least 24 h when stored in a tightly sealed vial at 8 °C.
Sample preparation for ADA activity measurements in DBS
Optimum conditions for ADA activity measurements were EHNA at a concentration of ≥10 µmol/L, a substrate concentration of 1.0 µmol/L, and incubation at 37 °C for ≥30 min.
Assay validation
Regression analysis of analyte-to-IS peak ratios versus concentration in dried calibrators revealed linear relationships between 0.1 and 100 µmol/L for all studied compounds. Analysis of DBS specimens containing Ado, dAdo, Guo, and dGuo at 5 and 25 µmol/L stored for a period of 5 weeks at −20 °C, 23 °C (ambient) and 30 °C revealed that these compounds are stable under the conditions described.
Within-day (n = 12) and between-day (n = 12) imprecision in purine measurements was evaluated by repeated analysis of the DBS QC samples. Table 1 summarizes the imprecisions expressed as a coefficient of variation (%), and the analytical recovery obtained using the dried calibrators.
Table 1:
The between-day (n = 20) and within-day (n = 20) reproducibility of ADA activity analysis in the DBS, expressed as the CV, was better than 21.3%.
Analysis of control and patient samples
In this work, ADA enzyme activity is expressed in picomoles of an isotope-labelled Ado or dAdo per DBS. These values were obtained by calculating the difference in residual 13C10, 15N5 Ado, and 15N5 dAdo in EHNA-treated (i.e., Test) and non-EHNA-treated (i.e., Blank) samples. In ADA-deficient samples, the added stable isotope substrates are not consumed by ADA in either the test or blank samples, and the difference between test and blank approaches zero. On the other hand, the observed difference between the test and the blank in normal samples is several orders of magnitude higher than that in patients (Table 2).
Table 2:
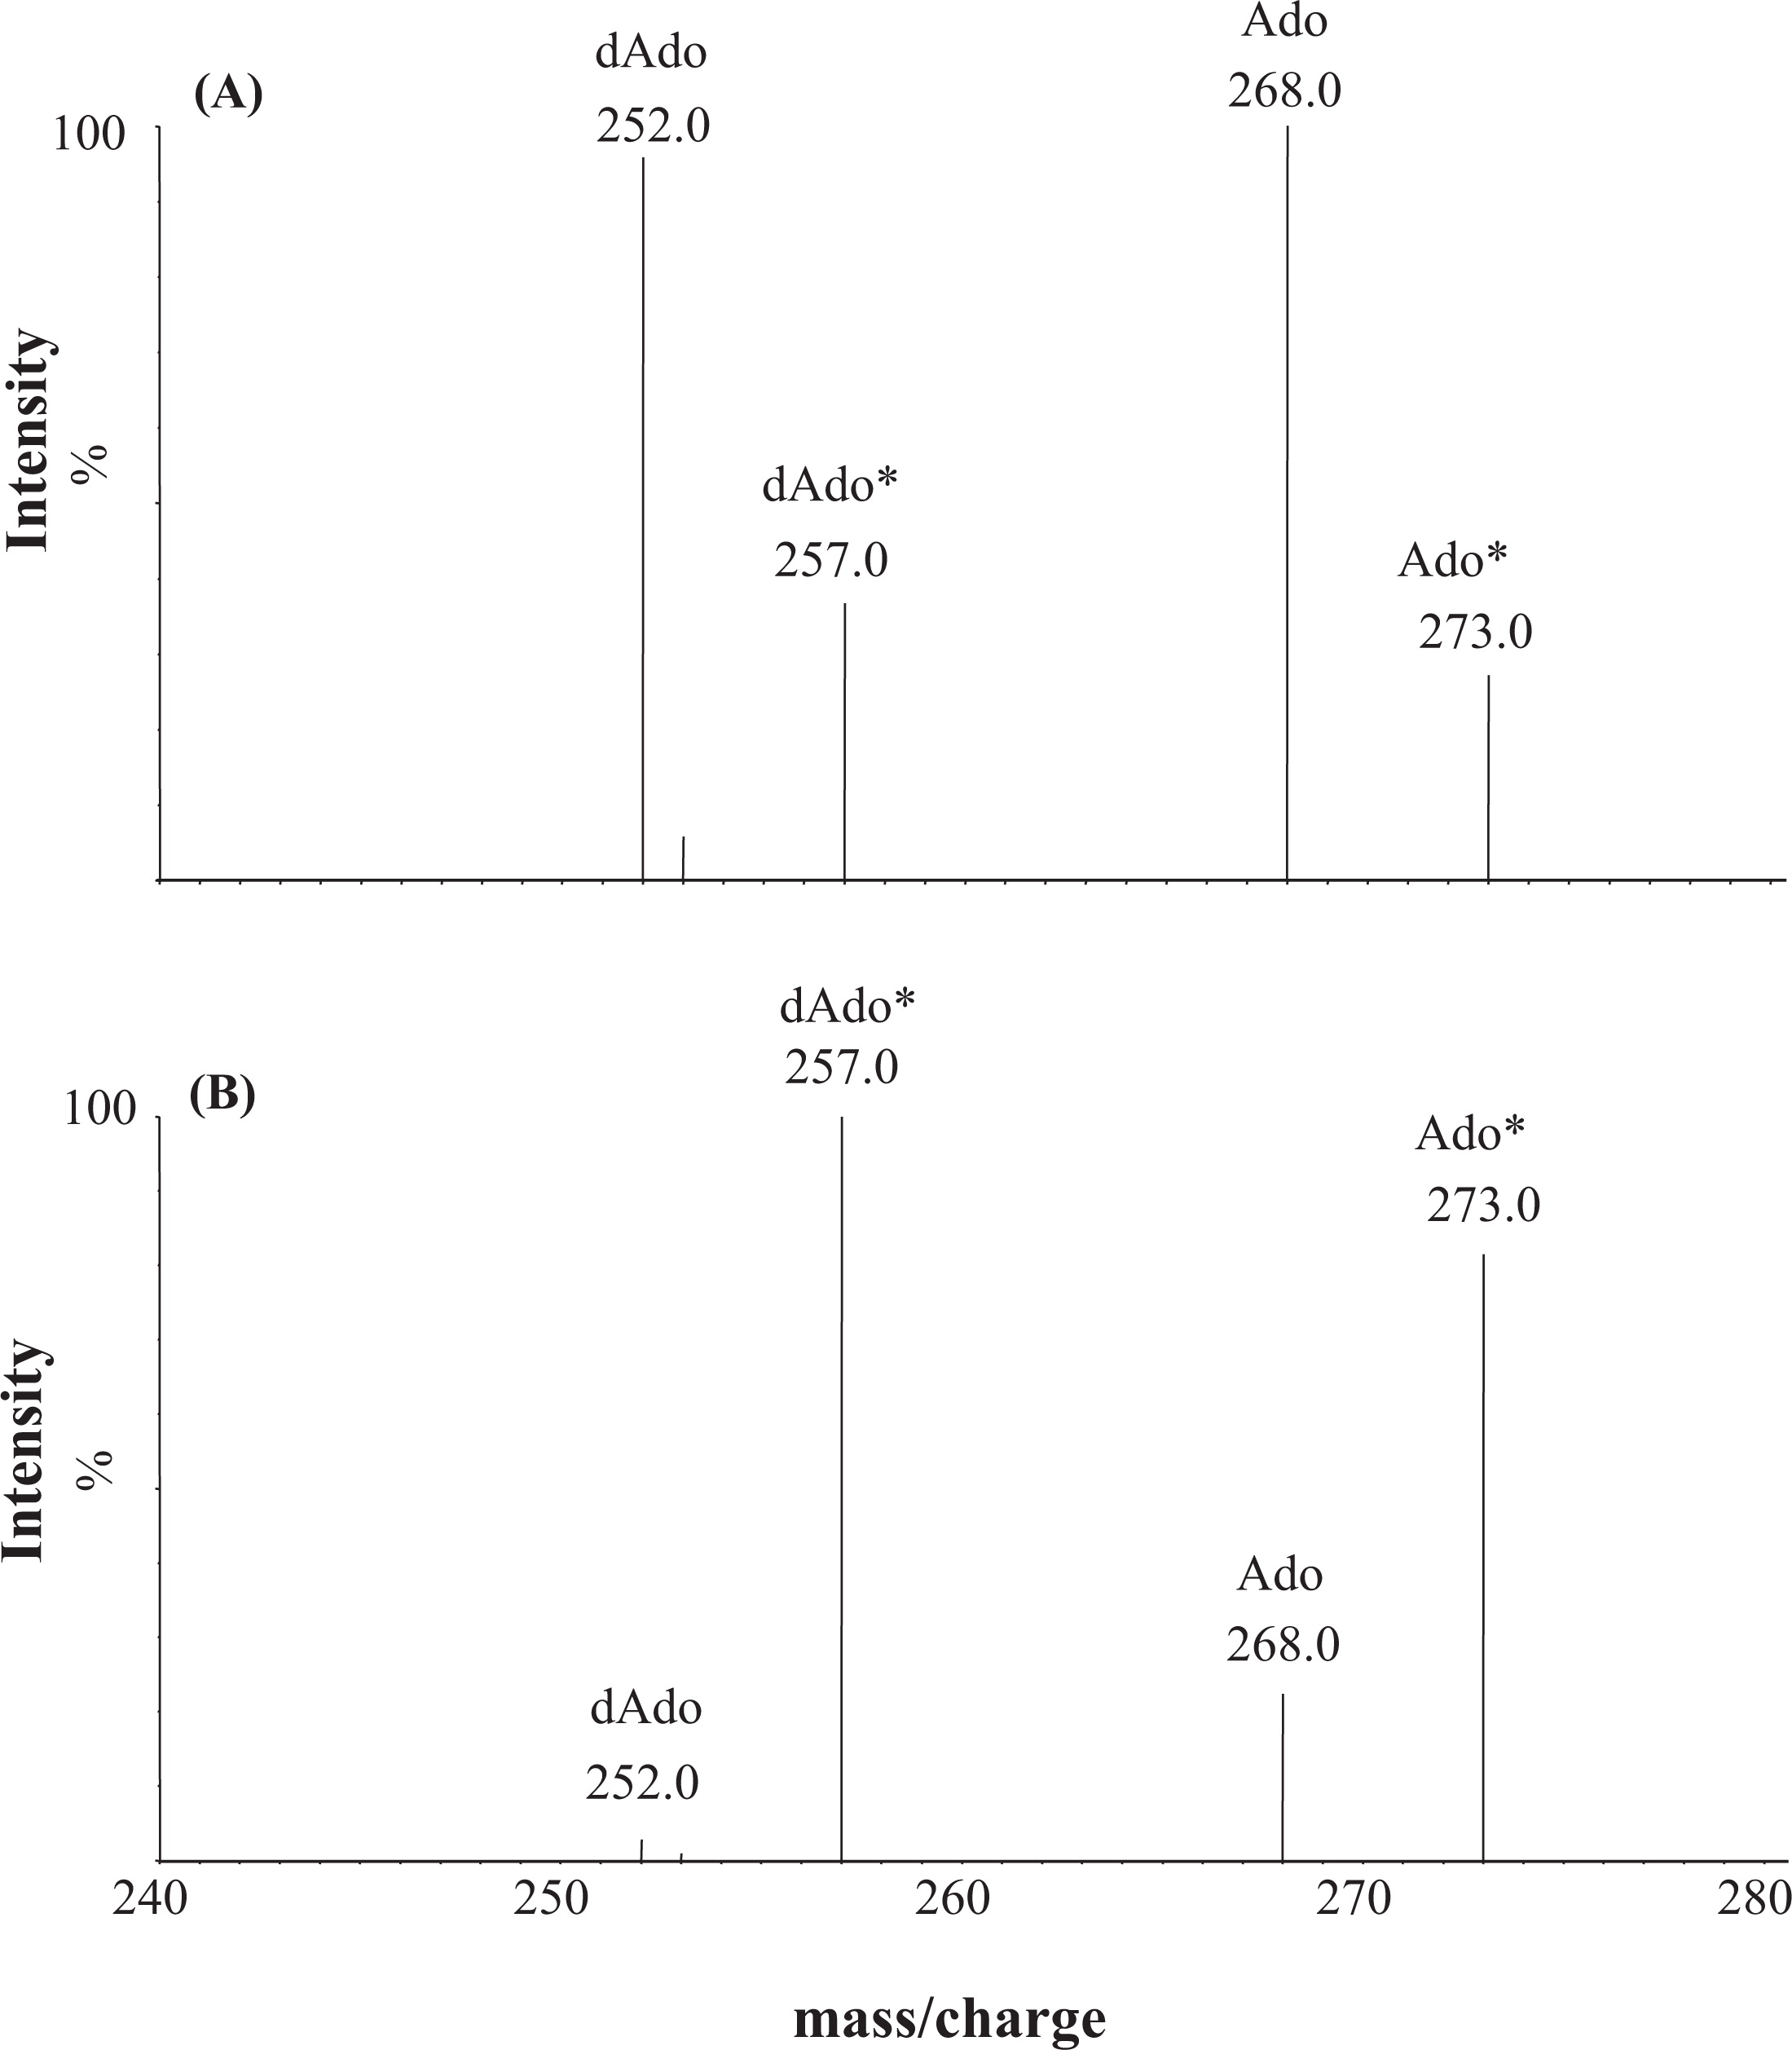
Reference intervals for TRECs, purine metabolites (n = 588), and ADA activity (n = 200) in DBS samples from healthy newborns are shown in Table 2. Pathological levels obtained in the DBS samples from patients with genetically confirmed ADA deficiency (n = 4) are also shown. Figure 2 shows the MS–MS spectra obtained with neonatal DBS specimens from an ADA patient (A) and a healthy newborn (B).
Figure 2:
Discussion
SCID newborn screening began in the United States following the recent addition of this condition to the uniform panel, as recommended by the U.S. Department of Health and Human Services. In Canada, Ontario was the first jurisdiction to screen for SCID, which began in August 2013. TREC analysis is the primary screening method and can be achieved with RT-PCR using neonatal DBS, which is the sample of choice for newborn screening. However, TREC analysis is inadequate to provide additional information regarding the etiology of SCID. This is particularly important in ADA–SCID, where progressive damage is likely caused by metabolite accumulation. ADA–SCID patients can be identified by measuring purine metabolites, namely Ado and dAdo, in DBS specimens. In the literature, analysis of these metabolites using MS–MS has been described; however, the published method does not allow for preparing control samples in whole blood, owing to residual enzyme activity (Azzari et al. 2011; la Marca et al. 2013; la Marca et al. 2014a). Further, the use of a single 13C labelled Ado IS in the published method is inappropriate, as it shares the same mass transition with the natural Ado isotope (la Marca et al. 2014a). Therefore, we sought to develop a method that employs spiked blood controls and extend it to encompass other purines such as Guo and dGuo, the markers for purine nucleoside phosphorylase deficiency within the same run (Chantin et al. 1996; la Marca et al. 2014b). In the early experiments, unlike Guo and dGuo, we noticed the immediate loss of Ado and dAdo upon adding standard purines to whole blood. A similar observation was also described by la Marca et al. (2014a) who ascribed this to residual ADA activity and opted to use aqueous calibrators. In MS–MS based methods, the use of matrix-matched control materials is an acceptable approach to reduce the matrix effect on target analytes (Kilcoyne and Fux 2010). Thus, in this work, pathological purine levels were achieved by spiking whole blood with EHNA and allowing this potent ADA inhibitor to restrict the enzyme activity prior to spiking the whole blood with purines. The EHNA-spiked blood imitates ADA deficiency, making it possible to create QC material with pathological enzyme activity and purine levels. The resultant DBS specimens were used as QC material and included in every analytical run throughout this work.
Purines are nitrogenous compounds, thus they are appropriate for detection by positive ion electrospray ionization MS–MS equipment commonly used in newborn screening laboratories. The precursor ions corresponded to protonated nucleosides and the fragmentation pattern observed is common to all studied compounds and is consistent with glycosidic bond cleavage. The use of specific MRM transitions to monitor these nucleosides enabled us to maximize the sensitivity, and eliminated the need for chromatographic separation. With a simple sample preparation and an MS–MS run of 2.5 min per sample, we were able to meet our required turn-around time and integrate purines measurements as an integral part of our routine screening process for SCID.
In this work, we designed our DBS QC material to cover a wide concentration range encompassing physiological and pathological Ado and dAdo levels to achieve maximum diagnostic value. The use of a stable isotope IS with 5 mass units greater than the target analytes eliminated the interference from naturally occurring isotopes and enhanced the quality of the quantitative data obtained.
Several metabolites and enzymes can be measured in neonatal DBS specimens indicating that the dry nature of this matrix provides a favourable environment that decreases degradation. In this work, we found purines in the DBS to be consistently stable for at least 5 weeks at temperatures ranging between –20 °C and 32 °C. This is particularly important, as stability during transport of DBS samples is essential to guarantee sample integrity and result validity. It is worth mentioning that purines and ADA activity in DBS are stable for long periods when stored under dry conditions at room temperature as evidenced by analyzing archived normal and abnormal samples that have been stored under the same conditions for up to 80 months.
As shown in Table 2, Ado and dAdo, as measured by the current method in DBS specimens from healthy newborns, were below 3.0 and 0.4 µmol/L, respectively. On the other hand, dAdo, and to a lesser extent Ado, were detected at significantly higher concentrations in newborn ADA–SCID patients. As expected, both Guo and dGuo were within normal limits in ADA-deficient patients.
We were able to confirm ADA–SCID by measuring the ADA activity in neonatal DBS specimens. The assay used was based on measuring the consumption of 13C10, 15N5 Ado and 15N5 dAdo by ADA using MS–MS and 13C5 Ado as an IS. Each sample was measured in duplicate with and without EHNA treatment to ensure accurate ADA measurements. Under the conditions used, the method clearly differentiated between ADA patients (n = 4) and healthy newborns (n = 200) with 100% sensitivity and specificity (Figure 3). However, further validation of assay conditions using more samples from patients known to have complete or partial ADA deficiencies may be required.
Figure 3:

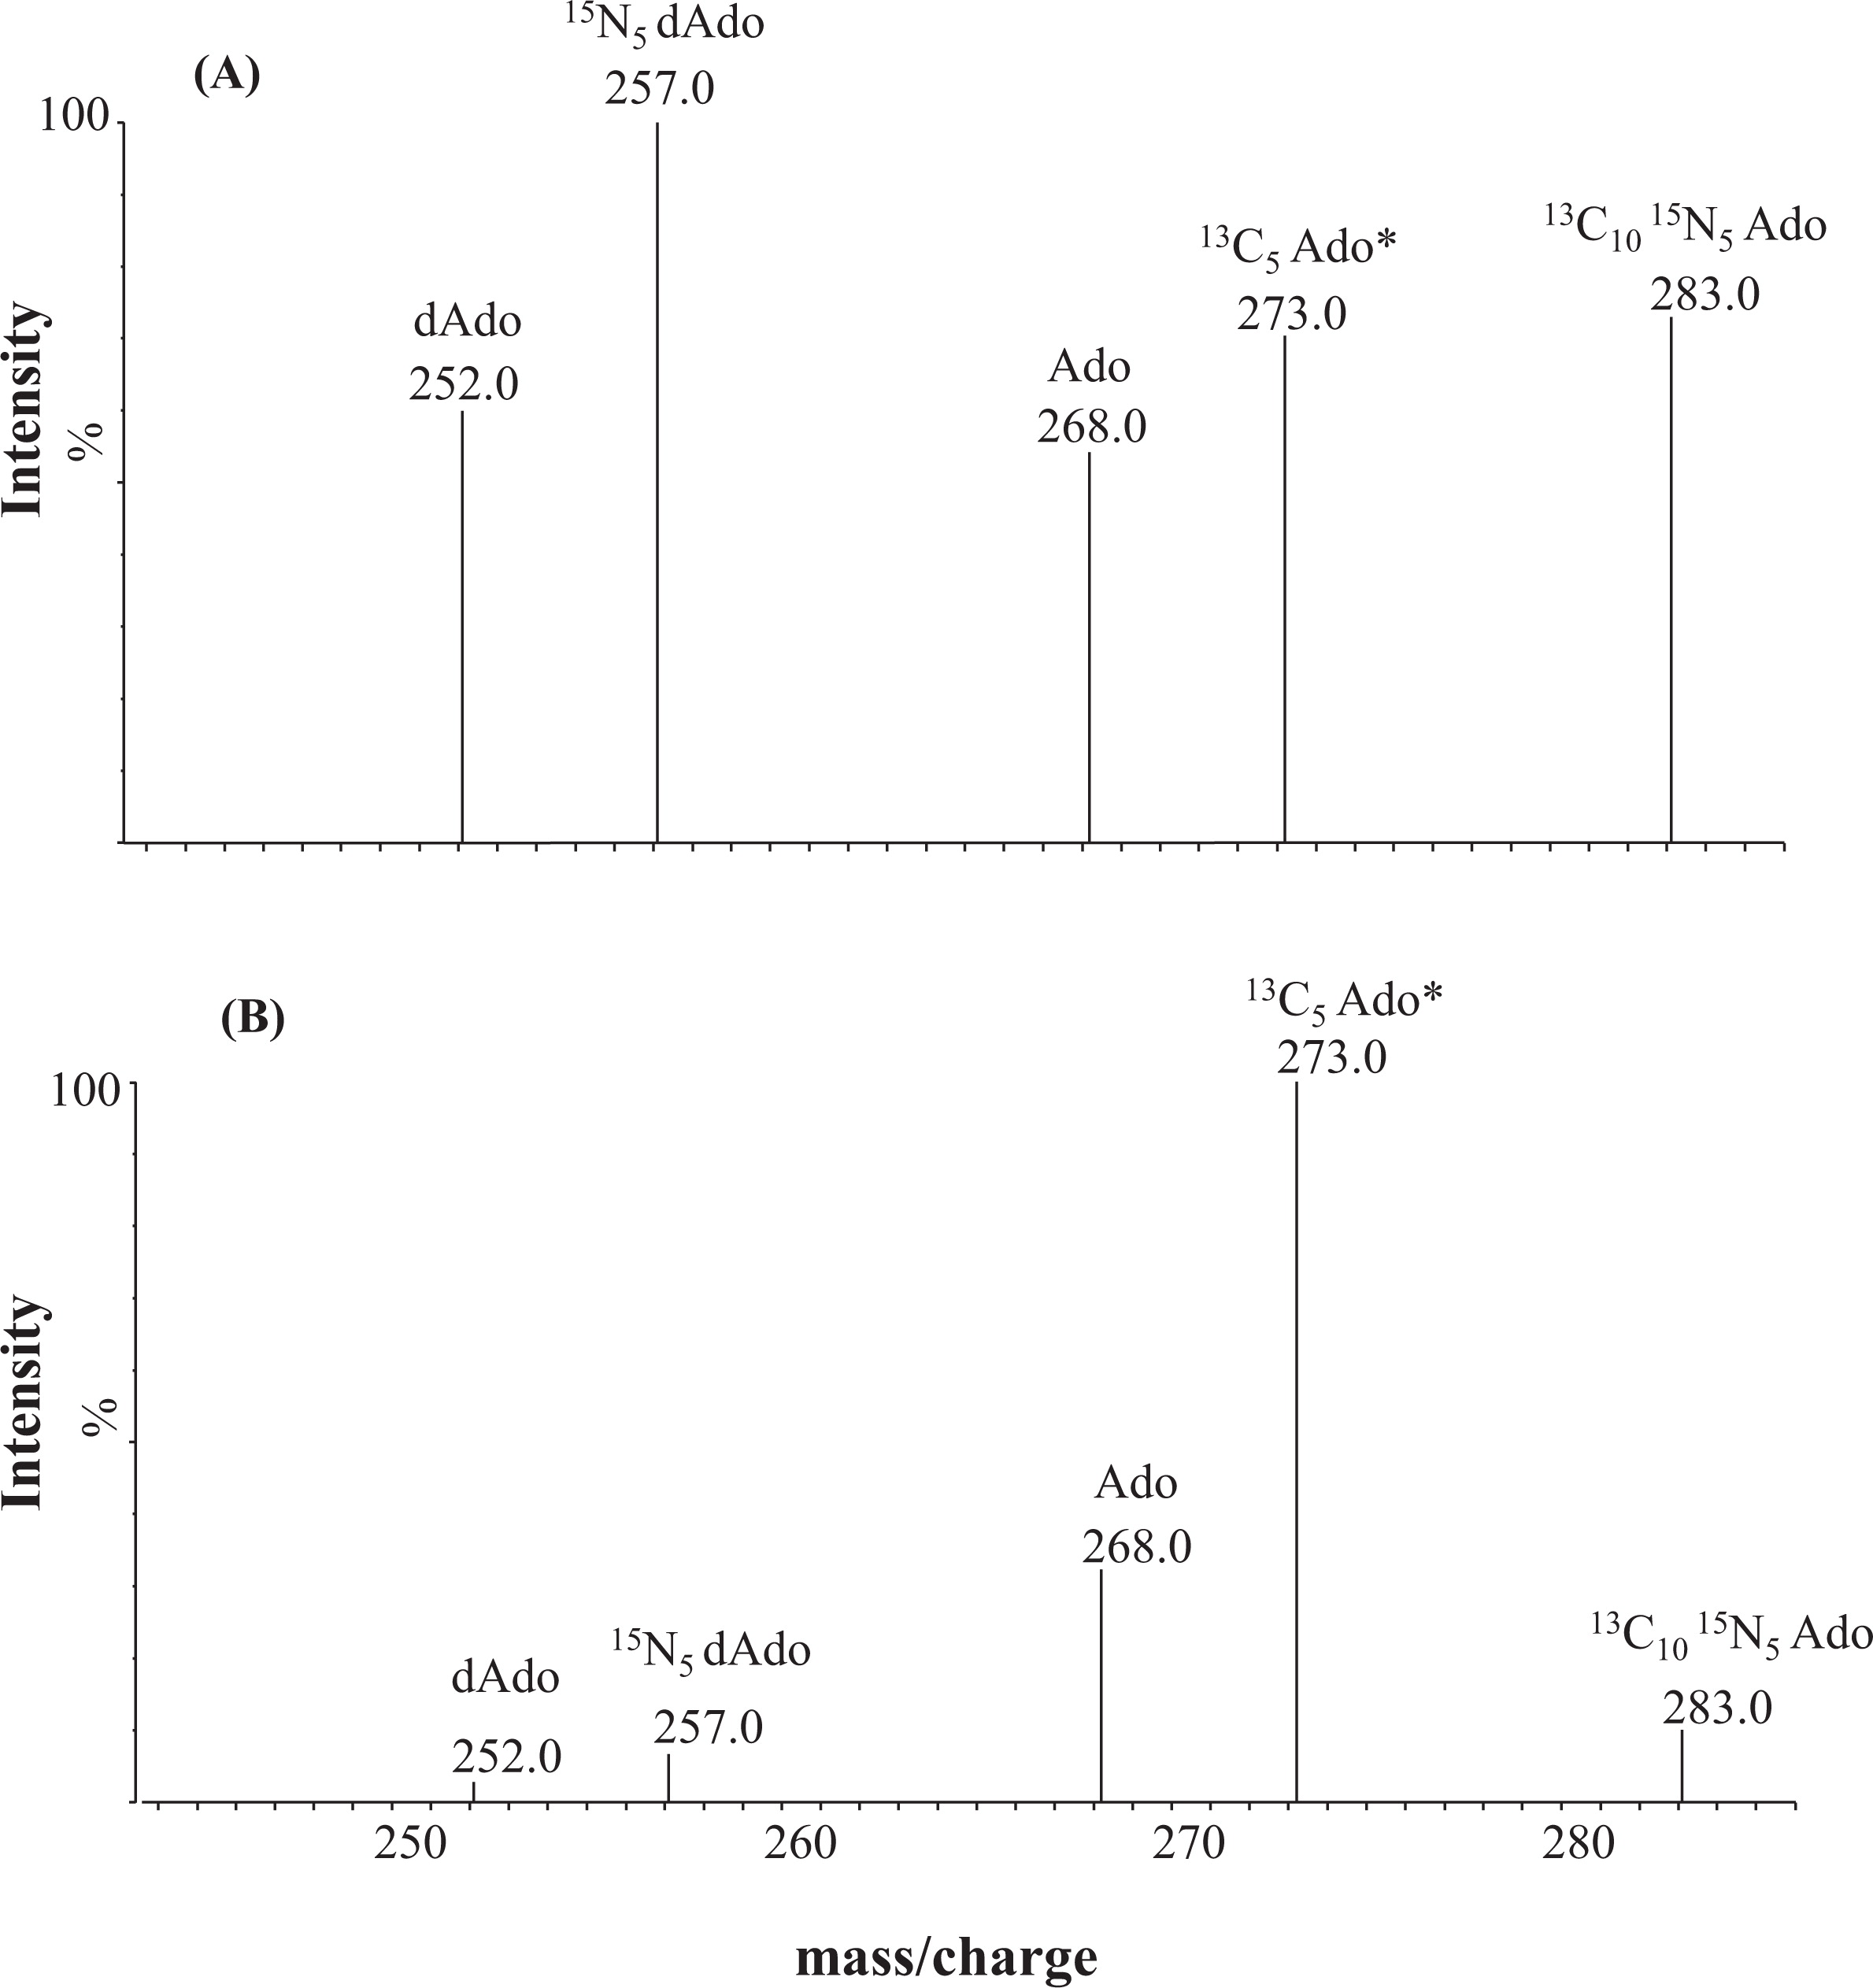
It has been reported that unlike TREC analysis, quantification of certain purine metabolites identifies newborns with late-onset ADA deficiency (la Marca et al. 2013). As a proof of concept, the potential of simultaneously measuring ADA activity and purine metabolites together with other established screening markers in a single mass spectrometric run was evaluated. This method involves combining the reconstituted residue of the blank preparation described above (i.e., without EHNA treatment) with the reconstituted amino acids and acylcarnitines preparation. Quantification of these additional markers (i.e., Ado, dAdo, 13C10, 15N5 Ado, and 15N5 dAdo) was multiplexed into our existing screening method for amino acids and acylcarnitines in a single injection. This combination allows for our novel methodology to be used as a primary screen for ADA–SCID with sensitivity adequate of detecting ADA–SCID with no additional burden on instrument time. The use of this methodology highlights the metabolic nature of ADA–SCID and complements TREC analysis by providing additional biochemical information. Figure 4 shows purine metabolic profiles obtained from DBS specimens of an ADA-deficient newborn (Figure 4A) and those from a normal newborn (Figure 4B).
Figure 4:
In conclusion, purine metabolites and ADA activity measurements in DBS samples from neonates are anticipated to improve, with excellent sensitivity, the timely identification of ADA–SCID patients. These novel methods are currently applied in our lab to samples with low TRECs, with no false negative or false positives encountered to date. The potential of using these methods as a primary screening approach for ADA–SCID is under validation.
REFERENCES
Azzari C., la Marca G., and Resti M. Neonatal screening for severe combined immunodeficiency caused by an adenosine deaminase defect: a reliable and inexpensive method using tandem mass spectrometry J. Allergy Clin. Immunol. 2011 127 1394 -1399
Chantin C., Bonin B., Boulieu R., and Bory Liquid-chromatographic study of purine metabolism abnormalities in purine nucleoside phosphorylase deficiency Clin. Chem. 1996 42 326 -328
Gaspar H.B., Aiuti A., Porta F., Candotti F., Hershfield M.S., and Notarangelo L.D. How I treat ADA deficiency Blood. 2009 114 3524 -3532
Hershfield, M.S., and Mitchell, B.S. 2001. Immunodeficiency diseases caused by adenosine deaminase deficiency and purine nucleoside phosphorylase deficiency. In The metabolic and molecular bases of inherited disease. Edited by D. Scriver, A. Beaudet, D. Valle, and W. Sly. McGraw-Hill, New York, NY. pp. 2585–2625
Kelly B.T., Tam J.S., Verbsky J.W., and Routes J. M. Screening for severe combined immunodeficiency in neonates Clin. Epidemiol. 2013 5 363 -359
Kilcoyne J. and Fux E. Strategies for the elimination of matrix effects in the liquid chromatography tandem mass spectrometry analysis of the lipophilic toxins okadaic acid and azaspiracid-1 in molluscan shellfish J Chromatogr A. 2010 1217 7123 -7130
Kwan A., Church J.A., Cowan M.J., Agarwal R., Kapoor N., Kohn D.B., Lewis D.B., McGhee S.A., Moore T.B., Stiehm E.R., Porteus M., Aznar C.P., Currier R., Lorey F., and Puck J.M. Newborn screening for severe combined immunodeficiency and T-cell lymphopenia in California: results of the first 2 years J. Allergy Clin. Immunol. 2013 132 140 -150
la Marca G., Canessa C., Giocaliere E., Romano F., Duse M., Malvagia S., Lippi F., Funghini S., Bianchi L., Della Bona M.L., Valleriani C., Ombrone D., Moriondo M., Villanelli F., Speckmann C., Adams S., Gaspar B.H., Hershfield M., Santisteban I., Fairbanks L., Ragusa G., Resti M., de Martino M., Guerrini R., and Azzari C. Tandem mass spectrometry, but not T-cell receptor excision circle analysis, identifies newborns with late-onset adenosine deaminase deficiency J. Allergy Clin. Immunol. 2013 131 1604 -1610
la Marca G., Giocaliere E., Malvagia S., Funghini S., Ombrone D., Della Bona M.L., Canessa C., Lippi F., Romano F., Guerrini R., Resti M., and Azzari C. The inclusion of ADA-SCID in expanded newborn screening by tandem mass spectrometry J. Pharm. Biomed. Anal. 2014a 88 201 -206
la Marca G., Canessa C., Giocaliere E., Romano F., Malvagia S., Funghini S., Moriondo M., Valleriani C., Lippi F., Ombrone D., Della Bona M.L., Speckmann C., Borte S., Brodszki N., Gennery A.R., Weinacht K., Celmeli F., Pagel J., de Martino M., Guerrini R., Wittkowski H., Santisteban I., Bali P., Ikinciogullari A., Hershfield M., Notarangelo L.D., Resti M., and Azzari C. Diagnosis of immunodeficiency caused by a purine nucleoside phosphorylase defect by using tandem mass spectrometry on dried blood spots J. Allergy Clin. Immunol. 2014b 134 155 -159
Matern D., Tortorelli S., Oglesbee D., Gavrilov D., and Rinaldo P. Reduction of the false-positive rate in newborn screening by implementation of MS/MS-based second-tier tests: the Mayo Clinic experience (2004–2007) J. Inherit. Metab. Dis. 2007 30 585 -592
Janzen N., Peter M., Sander S., Steuerwald U., Terhardt M., Holtkamp U., and Sander J. Newborn screening for congenital adrenal hyperplasia: additional steroid profile using liquid chromatography-tandem mass spectrometry J. Clin. Endocrinol. Metab. 2007 92 2581 -2589
Notarangelo L.D. Primary immunodeficiencies J. Allergy Clin. Immunol. 2010 125 S182 -S194
Notarangelo L.D. Partial defects of T-cell development associated with poor T-cell function J. Allergy Clin. Immunol. 2013 131 1297 -305
Nyhan, W.L. 2009. Purine and pyrimidine metabolism. In Pediatric endocrinology and inborn errors of metabolism. Edited by K. Sarafoglou, G.F. Hoffmann, and K.S. Roth. McGraw-Hill, New York, NY. pp. 757–786.
Pai S.-Y., Logan B.R., Griffith L.M., Buckley R.H., Parrott R.E., Dvorak C.C., Kapoor N., Hanson I.C., Filipovich A.H., Jyonouchi S., Sullivan K.E., Small T.N., Burroughs L., Skoda-Smith S., Haight A.E., Grizzle A., Pulsipher M.A., Chan K.W., Fuleihan R.L., Haddad E., Loechelt B., Aquino V.M., Gillio A., Davis J., Knutsen A., Smith A.R., Moore T.B., Schroeder M.L., Goldman F.D., Connelly J.A., Porteus M.H., Xiang Q., Shearer W.T., Fleisher T.A., Kohn D.B., Puck J.M., Notarangelo L.D., Cowan M.J., and O’Reilly R.J. Transplantation Outcomes for Severe Combined Immunodeficiency, 2000–2009 N. Engl. J. Med. 2014 371 5 434 -446
Puck J.M. Neonatal Screening for Severe Combined Immunodeficiency (SCID) Curr. Opin. Pediatr. 2011 23 667 -673
Puck J.M. Laboratory technology for population-based screening for severe combined immunodeficiency in neonates: the winner is T-cell receptor excision circles J. Allergy Clin. Immunol. 2012 129 607 -616
Sauer A.V., Brigida I., Carriglio N., and Aiuti A. Autoimmune dysregulation and purine metabolism in adenosine deaminase deficiency Front. Immunol. 2012 3 265
van den Berghe, G., Francoise Vincent, M., and Marie, S. 2006. Disorders of purine and pyrimidine metabolism. In Inborn metabolic diseases diagnosis and treatment. Edited by J. Fernandes, J.M. Saudubray, G. van den Berghe, and J.H. Walter, Springer, Heidelberg. pp. 433–449.
Verbsky J.W., Baker M.W., Grossman W.J., Hintermeyer M., Dasu T., Bonacci B., Reddy S., Margolis D., Casper J., Gries M., Desantes K., Hoffman G.L., Brokopp C.D., Seroogy C.M., and Routes J.M. Newborn screening for severe combined immunodeficiency; the Wisconsin experience (2008–2011) J. Clin. Immunol. 2012 32 82 -88
Vogel B.H., Bonagura V., Weinberg G.A., Ballow M., Isabelle J., DiAntonio L., Parker A., Young A., Cunningham-Rundles C., Fong C.-T., Celestin J., Lehman H., Rubinstein A., Siegel S., Weiner L., Saavedra-Matiz C., Kay D.M., and Caggana M. Newborn screening for SCID in New York State: experience from the first two years J. Clin. Immunol. 2014 34 3 289 -303
Information & Authors
Information
Published In
LymphoSign Journal
Volume 2 • Number 3 • September 2015
Pages: 135 - 145
History
Received: 29 December 2014
Accepted: 18 February 2015
Accepted manuscript online: 10 March 2015
Version of record online: 10 March 2015
Authors
Metrics & Citations
Metrics
Other Metrics
Citations
Cite As
Osama Y. Al-Dirbashi, Svetlana Ogrel, Nathan McIntosh, Lauren Higgins, Christine McRoberts, Larry Fisher, Dennis E. Bulman, Michael T. Geraghty, and Pranesh Chakraborty. 2015. Tandem mass spectrometric determination of purine metabolites and adenosine deaminase activity for newborn screening of ADA–SCID. LymphoSign Journal.
2(3): 135-145. https://doi.org/10.14785/lpsn-2014-0024
Export Citations
If you have the appropriate software installed, you can download article citation data to the citation manager of your choice. Simply select your manager software from the list below and click Download.
Cited by
1. Heterozygous mutations in RelB can be associated with immune dysregulation and lymphoma
View Options
View options
Login options
Check if you access through your login credentials or your institution to get full access on this article.
