Introduction
Viral hepatitis is a systemic disease that predominantly affects the liver leading to inflammation, and poses a major public health problem in most developing countries (
WHO 2014). Of all the known hepatotrophic viruses, Hepatitis B virus (HBV) is the major cause of liver disease morbidity and mortality world-wide (
Pourkarim et al. 2014). HBV infection alone accounts for over 360 million cases of chronic liver diseases and 0.62 million deaths per year. The pooled prevalence of estimated cases of chronic hepatitis B (CHB) in Nigeria is 13.6% (95% CI) (
Musa et al. 2015).
HBV is a small, circular, partial double DNA virus and a member of the hepadnaviridae family that causes hepatitis in multiple animal species (
Fletcher et al. 2019). It is approximately 3200-bp in size with four overlapping genes: S, C, P, and X (
CDC 2019). Different genotypes and sub-genotypes of HBV with varying geographical distribution, clinical presentation, and prognosis have been reported (
Pourkarim et al. 2014). HBV is transmitted perinatally, parenterally, through blood or blood products, or by unprotected intercourse (
Fletcher et al. 2019).
CHB is defined as persistency of hepatitis B surface antigen (HBsAg) in the blood for at least six months (
Hai-Jun et al. 2015). The progression of CHB infection comprises of more than one phase, consequently, an infected person can progress from a less complicated phase to those higher, and vice versa (
Karayiannis 2017). Each phase is characterized by specific biochemical, serological, and virological markers, including changes in serum alanine aminotransferase (ALT) levels, HBeAg serostatus, and HBV DNA titer (
Wiegand et al. 2019). The immune-tolerant (IT) phase, the first phase, is characterized by normal ALT, HBeAg(+) with high viremia. This is followed by the immune-clearance (IC) phase. In this phase, the immune system becomes activated, and is usually characterized by high ALT, HBeAg(+) and high viremia (
Wiegand et al. 2019). After HBeAg seroconversion, two clinical phases of CHB exist – an inactive phase (IA) usually presenting with normal ALT, HBeAg(-) with low viremia, and the second immune-escape (IE) phase with fluctuating ALT, HBeAg(-) and high viremia (
Hai-Jun et al. 2015). Therapeutic decision-making in CHB is mainly based on the presence of liver injury which occurs during IC and IE. ALT is largely considered a marker of immune-mediated liver damage, thus the two most commonly used biomarkers are elevated serum ALT and HBV DNA (
Pitaa et al. 2014;
Terrault et al. 2018). Recently, it was recommended that those in the IT phase should also be treated (
Klair et al. 2020).
Measurement of plasma protein fractions can be used for the diagnosis and monitoring of diseases given that it is relatively uniform in the healthy population, yet varied in some disease conditions (
Pimenta et al. 2019). A pattern of imbalance in protein fractions may indicate the presence of infection, inflammation, or autoimmune disease (
Gregory et al. 2012). Serum protein electrophoresis (SPE) is a versatile diagnostic technique, particularly in disease conditions where abnormal protein level is found in plasma/urine (
Hooijberg et al. 2018). A change in concentration of serum protein in the range of 0.5 g/L is enough to bring about variation in pattern of SPE (
Zhang et al. 2014). Chronic inflammation is typically manifested by an increase in immunoglobulins, which constitutes the slowest migrating band and most often occupies the β- and γ-region of the electropherogram (
Marceline et al. 2018). Polyclonal hypergammaglobulinemia (PHGG) is the most common abnormal electrophoretic finding and usually associated with liver disease, autoimmune disorder, malignancy, or infection (
Pimenta et al. 2019). Since immunoglobulins (γ-band) represent humoral factors, variation in its pattern could translate to changes in humoral immune status of the participants (
Marceline et al. 2018). A significant association has been reported between PHGG and histological manifestations in hepatic fibrosis, which correlated with the progression of liver damage (
Lebherz-Eichinger et al. 2015). However, in the available literature, there is scarce information regarding the distribution and significance of PHGG in CHB.
In view of the above, the aim of this study was to evaluate the incidence and pattern of PHGG in different phases of CHB. To our knowledge, this is the first study to evaluate the patterns of PHGG in untreated and categorized CHB infections.
Materials and methods
Ethical considerations
Ethical approval for this study was obtained from the ethical review committee of Kwara State Ministry of Health, Ilorin (MOH/KS/EU/777/245). Informed consent was obtained from eligible participants prior to enrollment. Questionnaires were used to gather sociodemographic data such as age, gender, marital status, family type, history of blood transfusion, presence of tattoo, number of partners, and maternal HBsAg status.
Study design
This is a community-based prospective longitudinal study among indigenes of Kisi in Oyo State, Nigeria.
Inclusion and exclusion criteria
Only participants that consented and who were within the age of 18–55 years were enrolled in the study. The samples included in the study met the following criteria: HBsAg(+) for at least six months (cases), no history of malignancy, alcohol intake, HCV and HIV. Pregnant women, asthmatic patients, individuals co-infected with tuberculosis, those with positive history of blood transfusion and antiviral treatment during the past four months were excluded from the study.
Sample collection
At first visit, approximately 2 mL of whole blood was collected from eligible participants. The samples were allowed to clot, retracted, and then centrifuged at 3000 rpm (Uniscope Inc, USA) for 10 minutes. The serum was screened for HBsAg, anti-Hepatitis C and HIV using rapid kits (Shanghai Eugene Biotech. Co, Shanghai and Determine
TM, Abbott). At least six months after the first sample collection, a second sample was taken from those with HBsAg(+) and re-screened using ELISA methods. Participants with HBsAg(+) after at least six months were considered CHB (
WHO 2014). ALT and HBeAg were assayed in the second sample.
HBsAg and HBeAg testing
HBsAg and HBeAg were analyzed using commercial ELISA kits (Bio-Inteco, UK and Monobond Inc., USA) using the method described by
Mohammad et al. 2014.
Liver enzymes assay
Serum ALT and AST level were measured with a commercial kit (Agape Diagnostic, Switzerland), using the method described by
Mohammad et al. 2014.
Total serum protein assay
Total serum protein (TSP) was measured colorimetrically using the Biuret method (
Goa 1953) while serum albumin (SA) was measured by direct spectrophotometric determination of albumin in human serum by dye binding method, using Bromocresol green dye (
Doumas et al. 1971). Total serum globulin (TSG) concentration was determined by calculating the difference between TSP and SA as reported elsewhere (
Al-Joudi and Wahab 2004).
Serum protein electrophoresis
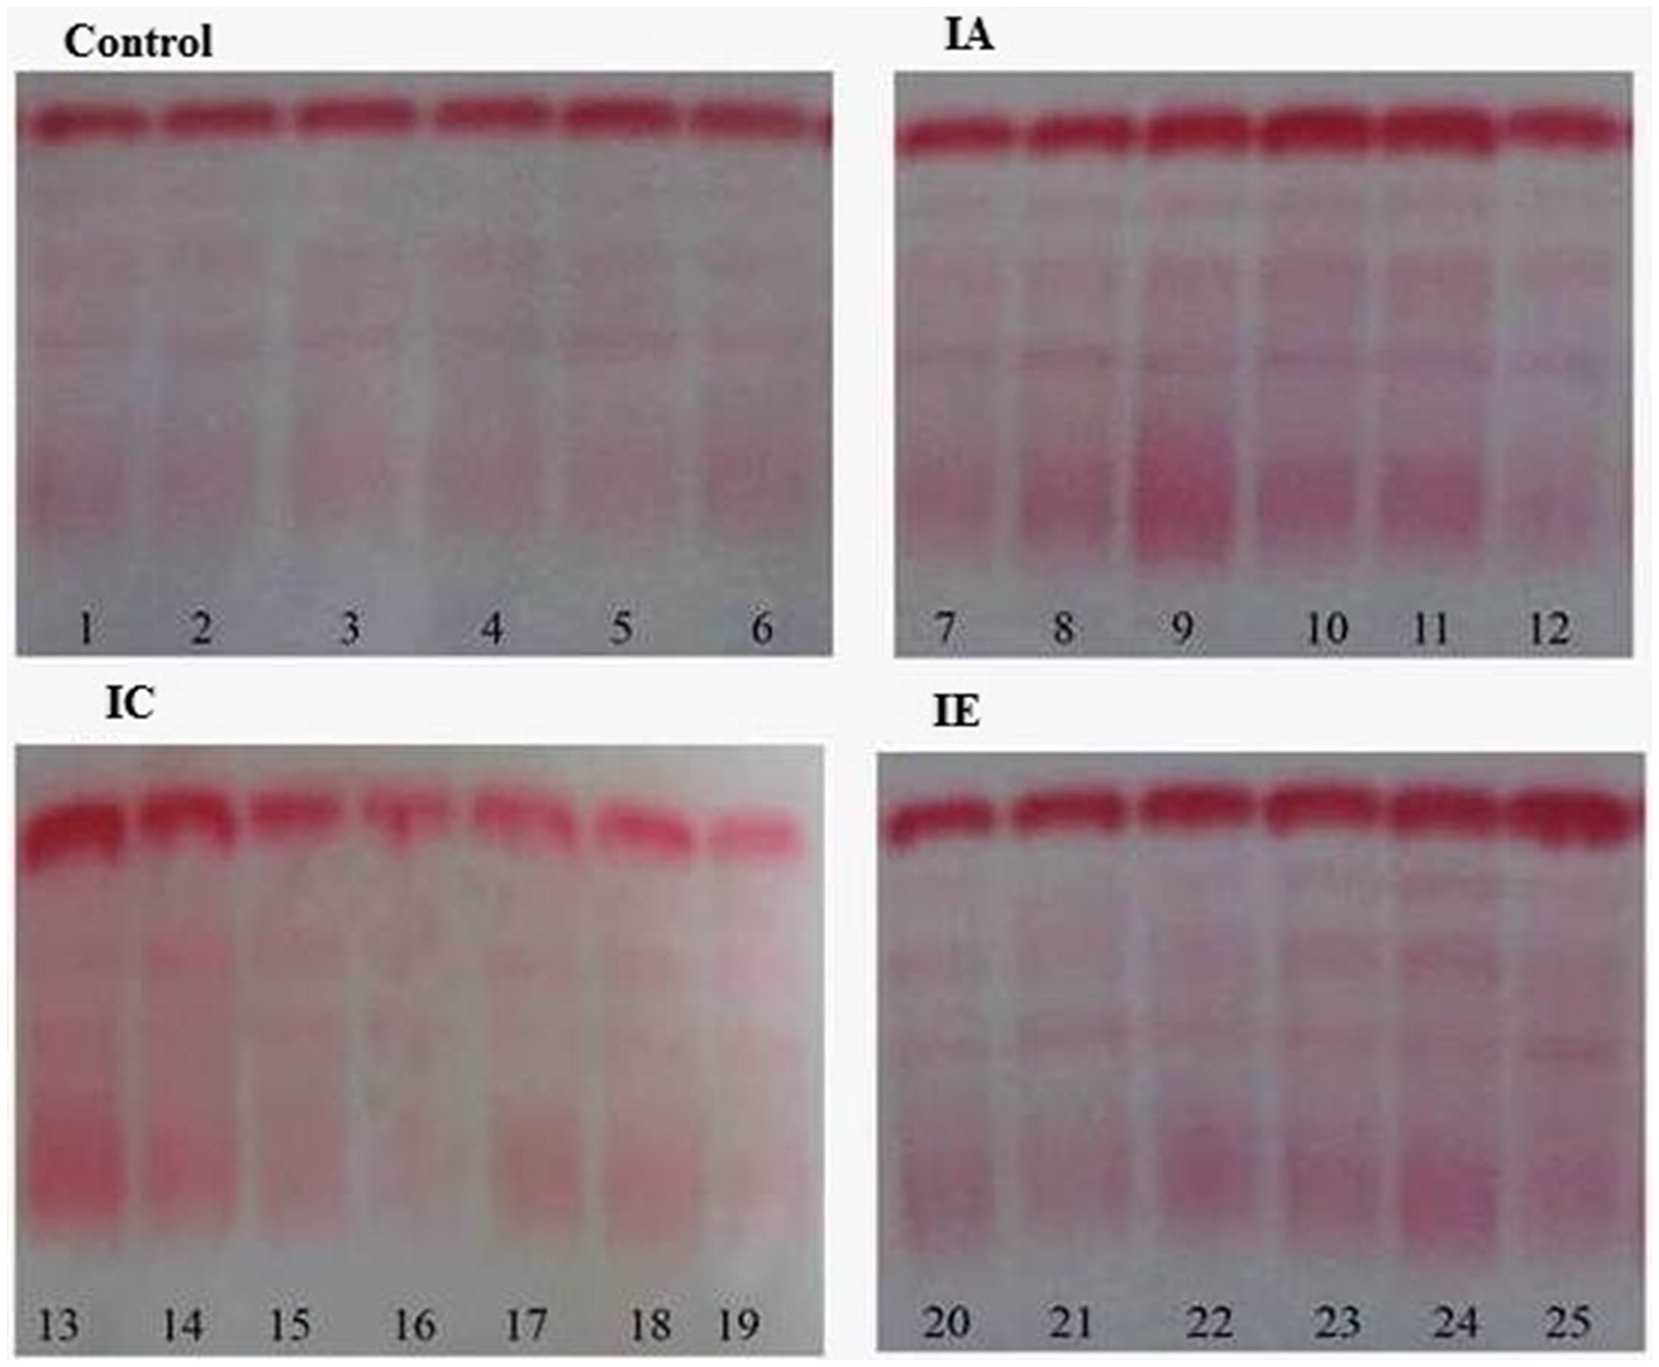
Serum protein electrophoresis (SPE) was performed using the Helena Electrophoresis system, according manufacturer’s instructions (Beaumont, TX; Sebia, Norcross, GA, USA). The electropherograms (
Figure 1) were independently examined by two of the authors (SIE and ALA) and discrepancies were resolved by consensus.
Quantification of protein fractions on electropherogram
The absolute value for globulin fractions (α1-, α2-, β- and γ-) in g/L were quantified by GelQuant image analysis software using method of
Zhuang et al. 2009 and
Mendoza and Lu 2015. Ponceau S. was preferred because the stained membrane can be de-stained quickly to leave a very low background, whereas some other stains give higher background (
Siegers et al. 1976). The electropherogram was scanned and the band intensity determined for both the albumin standard and tests in accordance with the software manufacturer’s instructions.
The absolute value of each protein band in g/L, were calculated using the formula below;
Statistical analysis
Statistical analysis was carried out using the IBM SPSS version 20 for window software (SPSS Inc. Chicago, IL USA). Descriptive analysis and one-way ANOVA test was used for the comparisons of data. Quantitative variables are presented as mean ± SD and qualitative variables as percent. p-values< 0.05 were considered significant. The Pearson correlation coefficient was used to test association between variables, as appropriate.
Discussion
The new baseline cut-off for ALT levels, 30 U/L in men and 19 U/L in women, as well as HBeAg status can be routinely used to determine the phase of CHB (
Nimer et al. 2009). Here, the participants in our study were classified into IA, IC, and IE phases based on their serum ALT level and HBeAg status. Individuals with HBsAg(-), HBsAb(-), HBeAb(-) and normal serum ALT were recruited as controls (
Table 1). Serum protein fractions were quantitatively and qualitatively measured. The electropherograms were interpreted according to the guide of Laboratory Corporation of America (Directory of Services and Interpretive Guide, Protein Electrophoresis). The electropherograms were further quantified for globulin fractions using GelQuant image analysis, processing, and quantitation program (
Khakabimamaghani et al. 2013).
Comparison of quantitative TSG and γ-globulin values across the groups revealed that both parameters were significantly elevated in the 3 phases of CHB with respect to the uninfected control group (data not shown). This observation was further supported by outcomes of the SPE assay; the majority (59.9%) of CHB subjects have electropherograms with diffused and more intense staining at the γ-region (
Figure 1). This may be attributed to hyperactivation of B cells due to chronic antigenic stimulation by soluble viral markers (
Ibrahim et al. 2016). In certain hepatic diseases such as HBV infection, particularly in chronic states, γ-globulin may be produced in increasing amounts by the hepatic reticuloendothelial cells (
Li et al. 2014).
Comparison of γ-globulin levels between the 3 pathological groups revealed significant elevation in the IA phase compared to IC and IE phase. In contrast, levels were comparable among IC and IE phases (
Table 2). PHGG has previously been identified as a manifestation of the complex immunological response to injurious stimuli, including pathogens or irritants (
Li et al. 2014). The difference in concentration of γ-globulin in phases of CHB observed in this study could therefore be attributed to varied B cell activation resulting from either/both host and viral factors. Previous studies have demonstrated that the level of some soluble viral markers, such HBsAg, HBcAg, HBV DNA, as well as host factors fluctuated in the phases of CHB (
Wiegand et al. 2019). Variation in level of those factors might be responsible for differences in B cell stimulation and thus different levels of immunoglobulins observed in this study. An in vitro study has indicated that HBsAg titers enhance the expression of the IL-6 and IL-1-β gene via transcriptional transactivation activity of CRP, and its level varied in phases of CHB (
Hao et al. 2017). The variation in immunoglobulin levels observed in this study may therefore be interpreted to signify a robust humoral response in IA subjects in relation to other phases. Consistent with this finding, the majority of non-progressor HIV-positive patients were characterized with PHGG (
Adedeji et al. 2014).
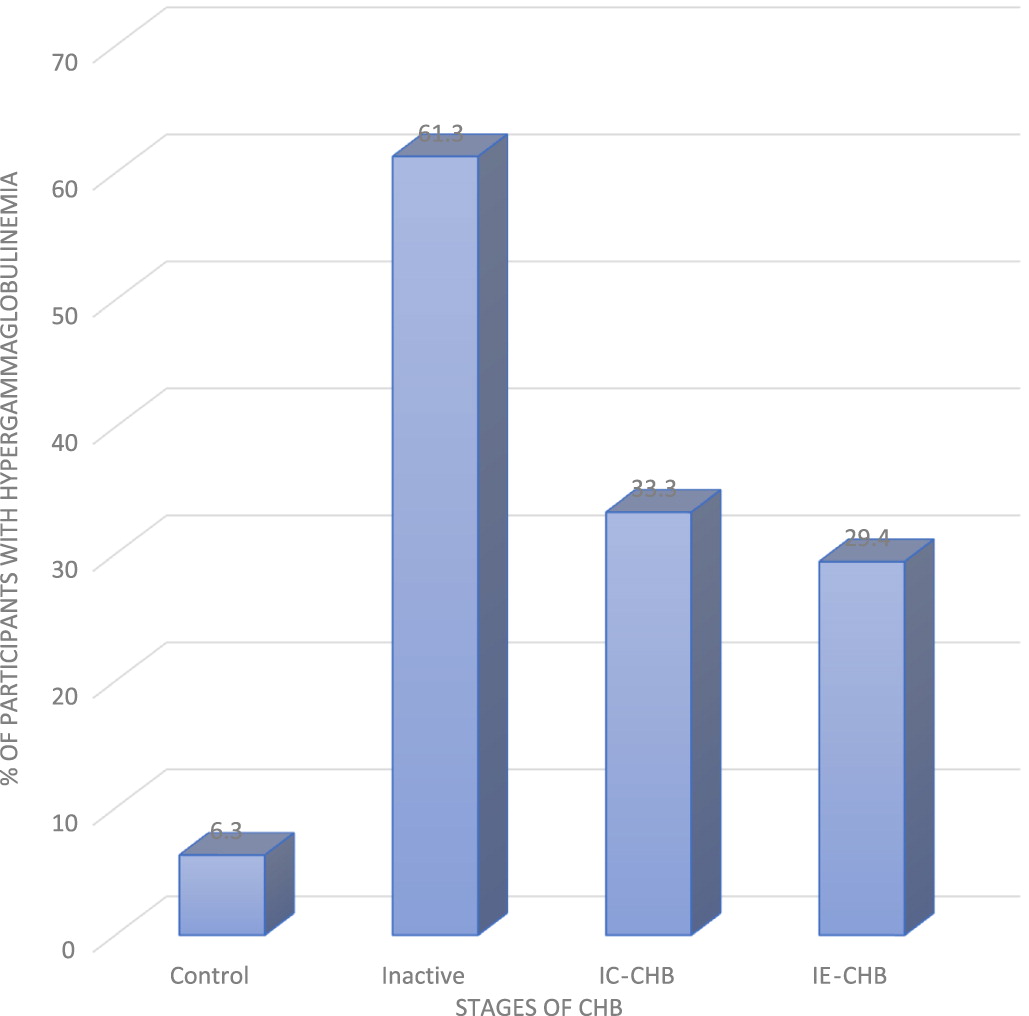
Incidence of PHGG among the 3 phases of CHB studied revealed that IA had the highest frequency of PHGG, follow by IC, and lastly IE (
Figure 2). This might be attributed to variation in levels of some viral soluble markers and cytokines profiles at different phases of CHB. It is well established that both host and viral factors are associated with the disease progression and clinical outcomes of CHB (
Yang et al. 2017). Of the 3 phases studied, the IA phase had the lowest HBsAg titer and HBV DNA (
Matsumoto et al. 2012). Consequently, it is expected to have lowest number of PHHG because of the stimulatory action of the two viral factors (
Hao et al. 2017). In view of this observation, it’s possible that a complex interaction exists between the level of immunoglobulins and soluble immune factors at different phases of CHB. Of note, about 6.3% of uninfected controls also showed mild diffuse increase in the γ-band (
Figure 2). This has been attributed to genetic disposition and other intrinsic host factors (
Adedeji et al. 2014). It may also be a manifestation of defective humoral or cellular immune responses (
Adedeji et al. 2021), or reflect the higher antigen load in the environment (
Tothova et al. 2018). Defective immunoglobulin clearance/metabolism may also underlie PHGG (
Hai-jun et al. 2015).
As shown in
Table 2, serum albumin was significantly lower in IC and IE phases compared to IA. Further, the percentage of participants with hypoalbuminemia (IA, 7.1%; IC, 23.5%; IE, 15.6%) could be attributed to a reduction in rate of synthesis, as inflammation is known to down-regulate albumin gene transcription (
Li et al. 2014).
Chojkier (2005) reported that secretion of TNF-α and IL-6 resulted in upregulation of catabolism and downregulation of hepatic synthesis of albumin. Based on the finding of moderate hypoalbuminemia, coupled with decreased albumin/globulin ratio in pathologic groups, particularly IC phase, it is likely that albumin synthesis is also adversely affected as the disease progresses.
Comparison of α1-, and β-globulins between the pathologic groups revealed no significant differences (
Table 2). An explanation for the apparently normal levels of α1- and α2-globulins sub-fractions is that participants were not severely ill. Elevation of α1-, α2-, and β-globulins is usually seen in severely ill patients (
Damburam et al. 2012). Thus, substantial pathological changes must occur before changes in the concentration of α- and β-globulin can be measured. For α2-globulins, a significant difference was observed between IA and IC phases (
Table 2), although the precise underlying mechanism remain unclear.
ROC analysis (
Table 3) revealed that PHHG has moderate sensitivity and specificity, and may thus help to identify the IA phase. This study further revealed that PHGG has high specificity and low sensitivity in both IE and IC phases. This observation suggests that PHGG can be used in ruling out those that are not in IE and IC phases. As a result, our study provides support for the use of PHGG as part of investigations in CHB management. The observed poor sensitivity in IE and IC phases could be attributed to lower prevalence ratios of PHGG in the two phases (18.9 and 15.9) respectively.
There are a few limitations to our study, including the inability to carry out genotyping in order to identify HBV mutants and determine the viral load for comparison of viral replication in different phases. Also, our cohort had a relatively low number of patients in the IC and IE phases. An absence of histology in the healthy and pathology groups is noted. Lastly, Gelquant image analysis software used for electrophrrogram quantification is prone to technical error. We preferred to use of Ponceau S. because the stained membrane could be de-stained quickly to leave a very low background. A further study on evaluation of IL-6 in different phases of CHB is recommended.