Abstract

Background: Primary immunodeficiency involving defective antibody formation requires antibody replacement therapy with immunoglobulin products to prevent and reduce infections. Immunoglobulin for intravenous use (IVIG) is a processed blood product with limited availability, and the various marketed IVIG products may have different tolerability among patients. New IVIG products are therefore necessary to offer options to patients and to reduce the risk of a product shortage.
Methods: Forty-five adult and pediatric patients with primary immunodeficiency, documented agammaglobulinemia or hypogammaglobulinemia, and antibody deficiency were enrolled in a prospective, multi-centre, open-label, single-arm historically controlled Phase III study to evaluate the safety, efficacy, and pharmacokinetics of a new 10% IVIG produced by Kedrion.
Results: Forty-four patients completed the study while one withdrew consent. Over the 12-month study period, only 2 episodes of acute serious bacterial infections (both bacterial pneumonias) were recorded, for a mean annual event rate of 0.04 per subject, with an upper one-sided 99% confidence limit of 0.11. Values for all secondary efficacy endpoints were comparable with those in similar studies. The primary safety endpoint was met as the rate of infusions temporally associated (i.e., within 72 hours) with ≥1 adverse event was 16% (upper 95% confidence limit 20.4%). Pharmacokinetics were assessed in 31 patients and found to be comparable with those published for other IVIG products.
Conclusion: Kedrion IVIG 10% is safe, efficacious, and well tolerated by patients with primary immunodeficiency.
Statement of novelty: This report describes the safety, efficacy, and pharmacokinetics of a new IVIG preparation.

Introduction

Purified immunoglobulin (IgG) has been used for more than half a century as a therapeutic modality to replace antibody deficiencies. Early immunoglobulin preparations were restricted to intramuscular injection (Janeway and Rosen 1966), and were clearly sub-optimal, as trough levels were low and insufficient for prevention of major infections (Eibl 2008). The introduction of IgG preparations suitable for intravenous use (IVIG), which were free from trace contaminants, revolutionized the treatment of these conditions (Nolte et al. 1979; Hooper 2008). Roifman et al (1987) have demonstrated that in patients with agammaglobulinemia, maintaining an IgG serum level of more than 500 mg/dL was superior to lower concentrations in preventing serious infections, as well as in improving lung disease. This threshold has been used for decades by clinicians as a minimum required trough level in patients with minimal endogenous IgG (Roifman et al. 1987; Orange et al. 2006; Eibl 2008). Subsequently, several reports have demonstrated that higher trough levels (700–900 mg/dL) may have further benefits in protecting patients from all types of infections (Roifman et al. 1987; Eijkhout et al. 2001; Orange et al. 2010).
Modern IVIG products have an excellent safety record and incorporate multiple effective measures of virus inactivation or removal in their manufacture (Hooper 2008). However, tolerability of products appears to be variable, with some patients tolerating some products but not others. It is therefore important to introduce new IVIG products to provide additional options for patients. Introduction of new safe products is also needed to generate a steady and adequate supply of a limited resource.
Kedrion IVIG 10% (Human) is a modern 10% liquid IVIG preparation produced using Cohn–Oncley fractionation (Cohn et al. 1946; Oncley et al. 1949) and anion-exchange chromatography. Several measures are employed to achieve virus inactivation/removal, including treatment with solvent detergent and nanofiltration.
We report here the results of a prospective multicenter clinical trial that studied the efficacy, pharmacokinetics (PK), safety, and tolerability of Kedrion IVIG 10% in patients with primary immunodeficiency (PID).

Methods

Study product

Kedrion IVIG 10% is a 10% (weight/volume) IgG (Human) solution for intravenous (IV) injection derived from US plasma donors and produced by Kedrion, S.p.A. at their manufacturing facilities in Bolognana (Lucca), Italy.
The drug product contains approximately 100 mg/mL of human plasma protein, at least 96% of which is IgG. The majority of the IgG protein (>90%) is present in a monomer plus dimer form. IgG molecules may interact forming aggregates and polymers. The product specification limits for polymers and aggregates is ≤3%. The maximum IgA content is 50 μg/mL. Other excipients include glycine (functioning as a stabilizer), sodium chloride, and water for injection. The product contains no preservatives.
Kedrion IVIG 10% has a pH between 4.0 and 5.5, with a mean osmolality of 287 mOsmol/kg (range: 267–296 mOsmol/kg; n = 15 clinical lots).
The Kedrion 10% Immune Globulin (Human) manufacturing process consists of the following steps that have been validated for their ability either to remove or inactivate viral pathogens:
Cold ethanol fractionation:
First step – precipitation of fraction I
Second step – precipitation and filtration of fraction II+III
Solvent/detergent treatment
Nanofiltration (20 nm)
Low pH incubation
Kedrion introduced an additional purification step (the first is the II+III precipitation), with sodium caprylate precipitation, whose efficacy in precipitation of contaminants and impurities is well known (Parkkinen et al. 2006). Sodium caprylate precipitates α and β globulins, lipids, kallikrein, and other contaminants. The precipitation with sodium caprylate has been shown to remove procoagulant activity and reduces the content of Coagulation Factor XIa by more than 99% (evaluated by thrombin generation assay).
After sodium caprylate contact, the solution is filtered and concentrated. It then undergoes solvent/detergent treatment. The solution is further purified by ion-exchange chromatography using a strong anion exchange resin that binds IgG. The recovered IgG solution is then diafiltered with a solution of saline and glycine and the pH is lowered to 4.0–4.5. It is then subjected to a specific step of viral removal, which is nanofiltration through a 20 nm filter. The nanofiltered solution is finally concentrated to the target protein concentration of 90–110 g/L. The final formulated IgG is bulk sterile filtered and aseptically filled into sterile, depyrogenated glass vials. Lastly, the final product undergoes low-pH incubation (a specific step of viral inactivation) and quarantine.
Kedrion IVIG 10% is derived from a minimum of 1000 plasma donors, thus, is expected to contain a broad spectrum of antibody specificities.

Study design

This was a prospective, open-label, single-arm, multi-centre, historically controlled, Phase III study measuring the efficacy, PK, safety, and tolerability of Kedrion 10% IVIG in patients with hypogammaglobulinemia and antibody deficiency. Prior to study enrollment, the diagnosis of PID was confirmed and included a review of infection history, serum IgG concentration prior to IgG therapy, and antibody responses to vaccination with polysaccharide and protein vaccines. The study design required at least 40 evaluable subjects aged 2–70 years, with well-defined PID and documented agammaglobulinemia or hypogammaglobulinemia, to be treated for 12 months to determine the rate of serious bacterial infections, and up to 30 patients were to be assessed for PK of the study product.
Upon consenting and screening, eligible subjects received IV infusions of the study product at the same dose and interval as used for their previous IVIG maintenance therapy. Kedrion IVIG 10% was administered at a dose of 300–900 mg/kg (of body weight) every 21 or 28 days (±4 days; depending on their pre-study IVIG treatment schedule) for a period of 12 months. The dose regimen remained unchanged throughout the study period unless there was a medically justified need to modify it. The total subject follow-up was approximately 14 months, during which subjects underwent 12 months of treatment, 13 treatment visits (subjects on 28-day infusion schedule) or 17 treatment visits (subjects on 21-day infusion schedule), and a follow-up visit 3 or 4 weeks after the last study drug infusion.
During the treatment and follow-up periods, patients underwent the following evaluations: adverse event monitoring and recording of concomitant medications, review of subject diaries, physical exam (prior to each infusion and at the follow-up visit), multiple vital signs assessments during the infusion and immediately after it was completed, and routine laboratory safety tests (hematology, blood chemistry, and urinalysis completed before each infusion and at the follow-up visit). Measurements of direct anti-globulin (DAT/Coombs) were performed before and after the first infusion, before and 24 hours after the fifth infusion, and at the follow-up visit. Viral safety testing was performed several times during the study and at its conclusion. PK assessments on 31 subjects were undertaken before and after the fifth study infusion.
The predefined primary efficacy endpoint was the incidence of acute serious bacterial infections (defined by the US Food and Drug Administration (FDA) as bacterial pneumonia, bacteremia/sepsis, osteomyelitis/septic arthritis, bacterial meningitis or visceral abscess) per subject during the 12-month treatment period (US FDA 2008). Serious adverse events (SAEs) potentially qualifying as primary endpoint events were adjudicated by the study Data and Safety Monitoring Board. Formal statistical analysis (noninferiority test) was applied for the occurrence of acute serious bacterial infection per subject. An upper 99% one-sided confidence limit of <1 per subject per year for the incidence of acute serious bacterial infection was predefined as an indicator of acceptable efficacy. To estimate the annualized event rate and develop the appropriate one-sided 99% upper confidence limit, a generalized linear models SAS procedure for Poisson regression PROC GENMOD was used. This procedure involves estimating a scale parameter of over-dispersion while it permits investigation of covariates, and it also allows for differential follow-up of subjects.

Summary of the inclusion criteria

Eligible patients were males or females aged 2–70 years, with PID who required treatment with IVIG. In addition to documented agammaglobulinemia or hypogammaglobulinemia, documented antibody deficiency was required. Subjects had to have received 300–900 mg/kg of a licensed IVIG therapy at 21- or 28-day intervals for at least 3 treatment cycles prior to study enrollment; if receiving subcutaneous immunoglobulin (SCIG), subjects had to switch to IGIV for 3 infusion cycles to establish a steady state prior to receiving Kedrion IVIG 10%. All subjects had to have at least 2 documented IgG trough levels of ≥ 500 mg/dL, obtained at 2 scheduled infusions (21 or 28 days) within 12 months (including one within 6 months) prior to study enrollment. Other immunoglobulin products were prohibited for 1 infusion cycle (21 or 28 days) prior to the first infusion of Kedrion 10% IVIG and until the completion of the first follow-up visit.
To participate in the study, all subjects or parents/guardians (in case of pediatric subjects, defined as 2–17 years of age at study entry) provided written informed consent. In addition, pediatric subjects completed assent forms as appropriate per local regulations.
Subjects receiving blood products other than human albumin or human immunoglobulin within 12 months prior to enrollment and subjects who had participated in another clinical study within 3 weeks prior to enrollment were excluded. The use of corticosteroids (oral or parenteral daily dose of ≥0.15 mg/kg/day of prednisone or equivalent), other immunosuppressive drugs or chemotherapy were prohibited.

Summary of the main exclusion criteria

Patients were excluded from the study if they had any of the following: secondary immunodeficiency; newly diagnosed, previously untreated PID; dysgammaglobulinemia; isolated IgG subclass deficiency; history of repeated reactions or hypersensitivity to IVIG or other injectable forms of IgG; IgA deficiency with known antibodies to IgA; lifetime history of any thrombotic event; significant protein-losing enteropathy, nephrotic syndrome, or lymphangiectasia; acute infection within 7 days prior to screening; known history of, or having tested positive at enrollment for, human immunodeficiency virus (HIV) type 1, HIV type 2, hepatitis B virus, hepatitis C virus, hepatitis A virus, or parvovirus B19; history of epilepsy or severe migraines, or transient ischemic attack; profound anemia or persistent severe neutropenia or lymphopenia; liver function tests (transaminases) above 2.5 times the upper limit of normal; presence of a severe chronic disease or other condition precluding safe participation in the study. Other gender-specific exclusion criteria included current or planned pregnancy, breastfeeding, or refusal to use adequate contraception for women of childbearing potential.

Evaluation of PK

PK evaluation was performed at or after infusion 5 of the study to wash out residual previous IVIG or SCIG products. Blood samples were taken before the infusion and at: 30 minutes, 2 hours, 24 hours, 3 (± 1) days, 7 (± 1) days, 14 (± 1) days, and either 21 (± 1) days or 28 (± 1) days following infusion. Samples were tested for the concentration of total IgG, IgG subclasses and specific antibody titers against tetanus toxoid, Streptococcus pneumoniae, Hemophilus influenzae type b, and measles. PK calculations related to total IgG and specific IgG antibodies included the following: maximum serum concentration (Cmax), minimum serum concentration (Cmin), the time to reach maximum concentration (Tmax), IgG elimination half-life (T1/2), the area under the concentration-time curve over one dosing interval (AUC0-t), the area under the concentration-time curve up to the last measurable concentration (AUC0-tau), the area under the concentration-time curve to infinity (AUC0-inf), and terminal elimination rate constant (λz). In addition, for total IgG, the following were analyzed: total body clearance (CL), volume of distribution at steady state (weight adjusted) (Vss), terminal exponential volume of distribution (weight adjusted) (Vz), incremental recovery (IR), and mean residence time (MRT). The degree of fit (R2) of the slope of the regression line had to be ≥0.80 for the reporting of t1/2, λz, and AUC0-inf, Vss, Vz, and MRT.

Results

Patient demographics

Between November 2012 and July 2013, 49 subjects were screened and 45 were enrolled (39 in the United States and 6 in Canada) to receive Kedrion 10% IVIG for 12 months. Enrollment at the 11 participating sites (9 in the United States and 2 in Canada) was initiated following appropriate Institutional Review Board/Research Ethics Board approval. Prior to enrollment, investigators verified that all patients strictly met inclusion and exclusion criteria. All patients had documented antibody deficiency and carried the diagnosis of agammaglobulinemia, hypogammaglobulinemia, or common variable immunodeficiency (Table 1).
Table 1:
Table 1: Subject demographics.
The enrolled population was predominantly Caucasian (91%); 71% were males and 29% females. Nine subjects (20%) were in the pediatric age group (aged 4–17 years at screening) and 36 (80%) were adults, including 9 elderly subjects (Table 1).

Immunoglobulin dosing and frequency

Patients were treated prior to the study for a mean of 8.9 years and a median of 8.2 years (Table 2). Dosing intervals were 21 days for 6 patients and 28 days for 39 patients. All 6 patients on the 21-day interval, and 38 of 39 patients on the 28-day interval, completed the study, for a total completion rate of 98%. Historical IgG levels prior to each subject’s initial replacement therapy were abnormal with a mean of 340 ± 218 mg/dL and a median of 363 mg/dL (Table 2). IgG trough levels taken at least twice during the 12 months prior to study entry (during prior replacement therapy) exceeded 500 mg/dL in all subjects. Mean IgG trough levels prior to study initiation were 923.9 mg/dL with a median of 921mg/dL during commercial IVIG treatment, with a mean and median IVIG dose of 501.7 mg/kg and 466 mg/kg, respectively. Interestingly, most subjects (25% or 56% of the total population) received a dose ≤500 mg/kg per infusion interval. During the study, the mean dose administered remained stable, 513.3 ± 146.4 mg/kg (median 506.9 mg/kg) at study entry and 526.2 ± 171.6 mg/kg (median 519.0 mg/kg) at study end.
Table 2:
Table 2: IVIG doses and trough IgG levels prior to initiation of the study.
*
Average of 3 prior IgG trough levels: 2 taken within up to 12 months prior to enrollment and 1 taken immediately prior to the first study drug infusion.
One patient received 914 mg/kg.

Note: IgG, immunoglobulin G; IVIG, intravenous immunoglobulin.

Efficacy of Kedrion 10% IVIG

Only 2 acute serious bacterial infections occurred during the study (in 2 adult patients, both with episodes of bacterial pneumonia), yielding an overall rate of acute serious bacterial infections of 0.048 per person per year, with an upper limit of the 99% one-sided confidence interval (CI) of 0.11 (generalized linear models procedure for Poisson regression) (Table 3), demonstrating the efficacy of Kedrion 10% IVIG. No acute serious bacterial infections occurred in the pediatric subgroup during the 12-month treatment period.
Table 3:
Table 3: Efficacy outcome: Primary endpoint.
*
Rate is calculated by dividing the number of infections by the number of subjects per 1-year study duration.
The 99% one-sided upper confidence limit for the incidence of infection (infection rate) was obtained with a generalized linear models procedure for Poisson regression.
Efficacy was also demonstrated using secondary endpoints during the 1-year treatment period (Table 4) including:
1.
The rates of missed work/school days and days unable to perform normal daily activities due to infection were low (mean 2.8 days and 3.4 days, respectively).
2.
The number of unscheduled visits to physicians was low (mean 0.9 days per patient per year).
3.
There was a mean of 23.3 days of antibiotic treatment.
4.
Three subjects (7%) required a total of 4 hospitalizations due to infection, including 2 episodes of bacterial pneumonia, 1 episode of infectious exacerbation of bronchiectasis, and 1 episode of Herpes zoster. For the overall study population, the mean annualized hospitalization rate due to infection was 0.11 and the mean annualized duration of the hospitalizations was 0.55 days.
Table 4:
Table 4: Efficacy outcomes: Secondary endpoints.
*
Mean event rate: days or visits per subject per year.
The majority of the enrolled subjects (78%) experienced at least 1 infection other than acute severe bacterial infections (referred to as “other infections” in subsequent text), with 5 subjects (11%) experiencing 1, 9 subjects (20%) each experiencing 2 or 3, and 12 subjects (27%) experiencing 4 or more other infections (Table 5). See Table 6 for categories of infections seen and the percentage for each. The overall incidence of other infection episodes was 2.884 per patient, per year.
Table 5:
Table 5: Efficacy outcome: Infections other than serious bacterial infections.
Table 6:
Table 6: Secondary endpoints: Infections other than serious bacterial infections.
*
The infection rates were calculated by dividing the number of infections by the subject’s study duration in years. The overall incidence of “other” infections was 2.884 per patient per year.

Adverse events (AE)

Overall, of the 602 infusions, 97 (16%) were temporally associated with an AE (defined as AEs occurring during or within 72 hours after an infusion of the study drug) (Table 7). The upper bound for the 95% CI for the frequency of infusions temporally associated with an AE was 20.4%. Therefore the primary safety objective of demonstrating that less than 40% of infusions had 1 or more infusion-related AE was met.
Table 7:
Table 7: Safety: Primary outcome.
*
Percentages were calculated relative to the total number of infusions (602).
95% Upper CI limit calculated using the generalized estimating equation method.
Less than one-third (14 subjects) of the total population experienced treatment-related AEs (53 events). Of those, 7 episodes in 4 subjects were assessed as “certainly related”, 5 episodes in 3 individuals as “probably related” and 41 episodes in 11 subjects as “possibly related” with the study drug (Table 8).
Table 8:
Table 8: Study drug-related adverse events (AEs).
A total of 8 SAEs occurred in 4 subjects during the study period. None were assessed as related to the study treatment and none resulted in withdrawal from the study. No clinically relevant changes from baseline were detected in mean hematology or blood chemistry parameters at the end of the treatment period or at the last follow-up.

Pharmacokinetics

The PK population included 31 subjects, of whom 6 were on a 21-day schedule and 25 were on a 28-day schedule. PK parameters for total IgG are shown in Table 9. Mean Cmax was 1980 ± 279 mg/dL for 21-day subjects, 1950 ± 357 mg/dL for 28-day subjects, and 1960 ± 339 mg/dL for all PK subjects. Mean AUC0-t was 26 300 ± 4790 day*mg/dL for 21-day subjects, 33 500 ± 5020 day*mg/dL for 28-day subjects, and 32 100 ± 5690 day*mg/dL for all PK subjects. The median Tmax was 0.16 days (range, 0.14–1.07 days) and 0.13 days (range, 0.07–1.06 days) for the 21-day or 28-day cycles, respectively. The calculated serum half-life (T1/2, mean ± SD) was 22.5 ± 4.5 days for the 21-day subjects, 37.1 ± 11.1 days for the 28-day subjects, and 35 ± 11.6 days for all PK subjects. Their T1/2 values corresponds to CL rates of 2.09 ± 0.45 mL/day/kg (21-day schedule), 1.55 ± 0.44 mL/day/kg (28-day schedule), and 1.66 ± 0.49 mL/day/kg (all PK subjects). Mean Vss was 0.75 ± 0.23 and 0.79 ± 0.22 dL/kg for 21-day and 28-day subjects, respectfully. Mean apparent MRT was longer for 28-day subjects compared with 21-day subjects (52.4 ± 15.4 vs 32.3 ± 6.29 days, respectively).
Table 9:
Table 9: Pharmacokinetics of total IgG after IV Infusions of Kedrion IVIG 10% in subjects with primary immunodeficiency.
*
For Tmax, values represent median and range and include the total infusion times.
Dose range across all subjects: 288–896 mg/kg.

Note: T1/2, IgG elimination half-life; Tmax, time to reach maximum IgG concentration; Cmax, maximum serum concentration; Cmin, minimum serum concentration; AUC0_t//AUC0-tau/AUC0-inf, area under the concentration-time curve over one dosing interval/up to the last measurable concentration/to infinity; CL, total body clearance; Vz and Vss, volume of distribution; MRT, mean residence time; IR, incremental recovery.

The mean T1/2 values for IgG subclasses and specific antibodies were generally the same as for total IgG, and demonstrated that the IgG subclasses and specific antibodies were not differentially affected by the manufacturing process.
Mean trough IgG levels at baseline (immediately prior to the first study IVIG infusion) were 976 ± 253 mg/dL and 917 ± 195 mg/dL for 21-day and 28-day subjects, respectively (Figures 1 and 2). Mean ± SD trough IgG levels were 1037 ± 282 mg/dL in 21-day subjects, and 865 ± 174 mg/dL in 28-day subjects after steady state was achieved, and 846 ± 230 mg/dL and 844 ± 163 mg/dL in the 2 subsets, respectively, at the follow-up visit. Five patients had trough IgG levels below 500 mg/dL transiently during the study period. In 2 of the 5 patients, this was a one-time recording and levels returned to above 500 mg/dL with no dose adjustments. In the remaining patients, low levels were recorded more than once, and in 2 subjects, there was a dose increase. In one patient this could be explained by the great swings in trough levels recorded during, as well as prior to enrollment, while on a stable dose of a commercial product (not shown). The second patient had 2 consecutive infections that required hospitalization (Table 10) and the third patient missed their infusion schedules by a week or more (Table 11). These cases illustrate the importance of recording and consistently adjusting doses before, during, and after serious infections in patients who are not compliant or have unstable IgG trough levels.
Figure 1:
Figure 1: Secondary endpoint: Mean IgG trough levels over 13 IVIG infusion cycles for the 28-day interval group. Mean ± SD IgG trough levels (mg/dL) were obtained prior to each infusion of Kedrion 10% IVIG in the 28-day interval group (n = 39). Trough levels immediately prior to the first infusion were 917 ± 195 mg/dL. At pre-infusion 6, after steady state was achieved, the trough IgG levels were 865 ± 174 mg/dL (p = 0.0127), and at pre-infusion 13, mean trough IgG levels were 840 ± 169 mg/dL (p = 0.0014). Wilcoxon signed-rank test was used in the case of skewed data, otherwise the p value was obtained from paired difference t test comparing the IgG trough level during the study with the subject’s baseline IgG trough level (trough concentration immediately prior to the first infusion).
Figure 2:
Figure 2: Secondary endpoint: Mean IgG trough levels over 13 IVIG infusion cycles for the 21-day interval group. Mean ± SD IgG trough levels (mg/dL) were obtained prior to each infusion of Kedrion 10% IVIG in the 21-day interval group (n = 6). Trough levels immediately prior to the first infusion were 976 ± 253 mg/dL. After steady state was achieved, the trough IgG levels at pre-infusion 6 were 1037 ± 282 mg/dL (p = 0.1898), and at pre-infusion 13, mean trough IgG levels were 832 ± 199 mg/dL (p = 0.0157). Wilcoxon signed-rank test was used in the case of skewed data, otherwise the p value was obtained from paired difference t test comparing the IgG trough level during the study with the subject’s baseline IgG trough level (trough concentration immediately prior to the first infusion).
Table 10:
Table 10: Decline in IgG trough levels (<500 mg/dL) following acute infection.
Table 11:
Table 11: Decline in IgG trough levels (<500 mg/dL) following delay in IVIG infusion.

Discussion

This clinical trial was conducted to evaluate the efficacy, safety, tolerability, and bioavailability of Kedrion 10% IVIG in patients with primary immunodeficiency. Current FDA and European Medicines Agency guidelines for IVIG studies were followed (US FDA 2008; European Medical Agency 2010), except for the pediatric enrollment being lower than required by both regulatory agencies for market approval.
Kedrion 10% IVIG was well tolerated by patients, as the rate of treatment-related AEs was low and the majority of adverse reactions were mild. Direct Coombs test was positive transiently in 47% of subjects, but it had no clinical significance, as observed in other clinical trials of IVIG (Roifman et al. 2003). Importantly, no evidence of hemolysis was recorded during the study period in any subject.
Overall AEs were comparable in nature and frequency to those seen during other IVIG clinical trials (Berger and Pinciaro 2004; Church et al. 2006; Stein et al. 2009; Moy et al. 2010; Wasserman et al. 2012). The primary safety objective of the study was to document the incidence of AEs that occurred during or within the first 72 hours following an infusion of the study product, whether or not the AE was determined to be product related. The primary safety endpoint was to demonstrate that the rate of infusions with one or more infusion-related AE is less than 40%. The results demonstrated that the frequency of infusions temporally associated with an AE was 16% (upper bound for the 95% CI: 20.4%), which is well below the FDA defined threshold, and is comparable with other IVIG products already in use (Berger and Pinciaro 2004; Church et al. 2006; Berger 2007; Stein et al. 2009; Moy et al. 2010; Wasserman et al. 2012).
No deaths occurred during the study period, and the 8 SAEs that occurred in 4 subjects during the study period were all clearly assessed as unrelated to the study treatment product.
Kedrion 10% IVIG was found to be efficacious by meeting the primary study endpoint, which was less than 1.0 acute serious bacterial infection per subject per year. Two acute serious bacterial infections occurred during the entire study period and thus the upper limit of 99% confidence interval was 0.11. Secondary efficacy endpoints were also remarkable for low rates of missed work/school days. The mean rate for the subject missing work/school was 2.8 days per subject per year, which is comparable to reports describing other IVIG products (Berger and Pinciaro 2004; Berger 2007; Stein et al. 2009; Wasserman et al. 2012) and is lower than the average number missed days of work per year by US workers (Centers for Disease Control and Prevention 2013; Official Disability Guidelines 2013). The frequency of unscheduled visits to a physician’s office or emergency room were extremely low and far below the mean of 3.0 predicted in the normal population and below most published reports in IVIG trials. Very limited use of therapeutic antibiotics and a low rate of hospitalization were also recorded in this study.
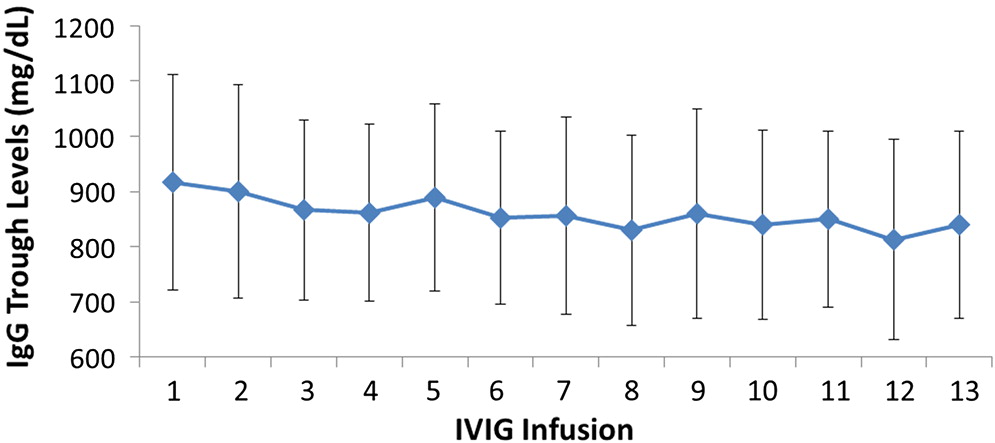
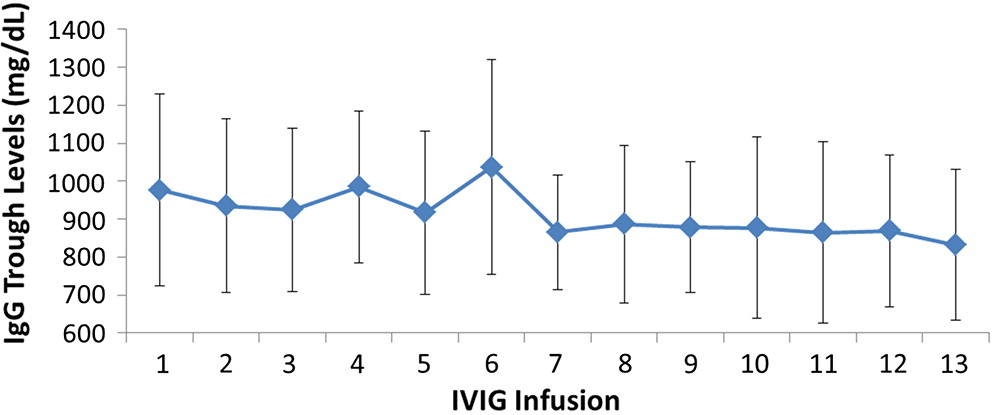
All patients had serum IgG trough levels higher than 500 mg/dL at the end of the study with mean concentrations of 843.7 ± 169.8 and a median of 828.0 mg/dL, a level shown to be extremely effective in preventing infections in patients with PID (Roifman et al. 1987, 2003). PK studies of total IgG, IgG subclasses, and specific antibodies confirmed the good bioavailability of Kedrion 10% IVIG.
In summary, this clinical trial enrolled subjects with confirmed PID and antibody deficiency. The results of excellent tolerability and efficacy of Kedrion IVIG 10% are therefore significant and compare favorably to other IVIG products currently available.

REFERENCES

Berger M., Flebogamma® 5% DIF Investigators. 2007. A multicenter, prospective, open label, historically controlled clinical trial to evaluate efficacy and safety in primary immunodeficiency diseases (PID) patients of Flebogamma® 5% DIF, the next generation of Flebogamma®. J. Clin. Immunol.27(6):628–633.
Berger M. and Pinciaro P.J., Flebogamma 5% Investigators. 2004. Safety, efficacy, and pharamacokinetics of Flebogamma 5% for replacement therapy in primary immune deficiency. J. Clin. Immunol.24(4):389–396.
Centers for Disease Control and Prevention. 2013. FastStats. [Online]. Available from http://www.cdc.gov/Nchs/fastats/ [accessed 13 January 2014].
Church J.A., Leibl H., Stein M.R., Melamed I.R., Rubenstein A., Schneider L.C., Wasserman R.L., Pavlova B.G., Birthistle K., Mancini M., Fritsch S., Patrone L., Moore-Perry K., and Ehrlich H.J., the US-PID-IVIG 10%-Study Group. 2006. Efficacy, safety and tolerability of a new 10% liquid intravenous immune globulin (IGIV 10%) in patients with primary immunodeficiency. J. Clin. Immunol.26(7):388–395.
Cohn E.J., Strong L.E., Hughes W.L., Mulford D.J., Ashworth J.N., Melin M., and Taylor H.L.1946. Preparation and properties of serum and plasma proteins: A system for the separation into fractions of the protein and lipoprotein components of biological tissues and fluids. J. Am. Chem. Soc.68:459–475.
Eibl M.M.2008. History of immunoglobulin replacement. Immunol. Allergy Clin. North Am.28(4):737–764.
Eijkhout H.W., van Der Meer J.W., Kallenberg C.G., Weening R.S., van Dissel J.T., Sanders L.A., Strengers P.F., Nienhuis H., and Schellekens P.T., Inter-University Working Party for the Study of Immune Deficiencies. 2001. The effect of two different dosages of intravenous immunoglobulin on the incidence of recurrent infections in patients with primary hypogammaglobulinemia. A randomized, double-blind, multicenter crossover trial. Ann. Intern. Med.135(3):165–174.
European Medicines Agency (EMA). 2010. Committee for Medicinal Products for Human Use (CHMP): Guideline on the clinical investigation of human normal immunoglobulin for intravenous administration (IVIG). EMA/CHMP/BPWP/94033/2007 rev. 2; 22 July 2010.
Hooper J.A.2008. Intravenous immunoglobulins. Evolution of commercial IVIG preparations. Immunol. Allergy Clin. North Am.28(4):765–768.
Janeway C.A. and Rosen F.S.1966. The gamma globulins. IV. Therapeutic uses of gamma globulin. N. Engl. J. Med.275(15):826–31.
Moy J.N., Scharenberg A.M., Stein M.R., Suez D., Roberts R.L., Levy R.L., Ballow M., Fasano M.B., Dash C.H., and Leach S.J.2010. Efficacy and safety of a new immunoglobulin G product. Gammaplex, in primary immunodeficiency diseases. Clin. Exp. Immunol.162(3):510–515.
Nolte M.T., Pirofsky B., Gettitz G.A., and Golding B.1979. Intravenous immunoglobulin therapy for antibody deficiency. Clin. Exp. Immunol. 36:237–243.
Official Disability Guidelines. 2013. [Online]. Available from http://www.disabilitydurations.com/pr_repmdc.html [accessed 13 January 2014].
Oncley J.L., Melin M., Richert D.A., Cameron J.W., and Gross P.M.1949. The separation of the antibodies, isoagglutinins, prothrombin, plasminogen and beta1-lipoprotein into subfractions of human plasma. J. Am. Chem. Soc.71(2):541–550.
Orange J.S., Grossman W.J., Navickis R.J., and Wilkes M.M.2010. Impact of trough IgG on pneumonia incidence in primary immunodeficiency: A meta-analysis of clinical studies. Clin. Immunol.137(1):21–30.
Orange J.S., Hossny E.M., Weiler C.R., Ballow M., Berger M., Bonilla F.A., Buckley R., Chinen J., El-Gamal Y., Mazer B.D., Nelson R.P. Jr., Patel D.D., Secord E., Sorensen R.U., Wasserman R.L., and Cunningham-Rundles C., Primary Immunodeficiency Committee of the American Academy of Allergy, Asthma and Immunology. 2006. Use of intravenous immunoglobulin in human disease: A review of evidence by members of the Primary Immunodeficiency Committee of the American Academy of Allergy, Asthma and Immunology. J. Allergy Clin. Immunol.117(4 Suppl):S525–S553.
Parkkinen J., Rahola A., von Bonsdorff L., Tolo H., and Torma E.2006. A modified caprylic acid method for manufacturing immunoglobulin G from human plasma with high yield and efficient virus clearance. Vox. Sang.90(2):97–104.
Roifman C.M., Levison H., and Gelfand E.W.1987. High dose verses low-dose intravenous immunoglobulin in hypogammaglobinemia and chronic lung disease. Lancet. 1(8541):1075–1077.
Roifman C.M., Schroeder H., Berger M., Sorensen R., Ballow M., Buckley R.H., Gewurz A., Korenblat P., Sussman G., and Lemm G.2003. Comparison of the efficacy of IGIV-C, 10% (caprylate/chromatography) and IGIV–SD, 10% as replacement therapy in primary immune deficiency. A randomized double-blind trial. Int. Immunopharmacol. 3(9):1325–1333.
Stein M.R., Nelson R.P., Church J.A., Wasserman R.L., Borte M., Vermylen C., and Bichler J.2009. Safety and efficacy of Privigen®, a novel 10% liquid immunoglobulin preparation for intravenous use, in patients with primary immunodeficiency. J. Clin. Immunol.29(1):137–144.
US FDA. 2008. Guidance for Industry: Safety, Efficacy, and Pharmacokinetic Studies to Support Marketing of Immune Globulin Intravenous (Human) as Replacement Therapy for Primary Humoral Immunodeficiency [Online]. Available from http://www.fda.gov/biologicsbloodvaccines/guidancecomplianceregulatoryinformation/guidances/blood/ucm072130.htm [accessed 11 April 2016].
Wasserman R.L., Church J.A., Stein M., Moy J., White M., Strausbaugh S., Schroeder H., Ballow M., Harris J., Melamed I., Elkayam D., Lumry W., Suez D., and Rehman S.M.2012. Safety, efficacy, and pharmacokinetics of new liquid intravenous immunoglobulin (IVIG) in patients with primary immunodeficiency. J. Clin. Immunol.32(4):663–669.

Information & Authors

Information

Published In

cover image LymphoSign Journal
LymphoSign Journal
Volume 3Number 3September 2016
Pages: 99 - 109

History

Received: 1 April 2016
Accepted: 2 August 2016
Accepted manuscript online: 2 August 2016

Authors

Affiliations

Allergy Associates of the Palm Beaches, North Palm Beach, FL, USA
Agnes Nemet
CLINSIG Research Consulting Inc., Brampton, ON
Santhosh Kumar
Virginia Commonwealth University Health System, Richmond, VA, USA
William Lumry
AARA Research Center, Dallas, TX, USA
Hartwig Gajek
Kedrion S.p.A., Lucca, Italy
Roberta Macchia
Kedrion S.p.A., Lucca, Italy
Vladislava Zamfirova
Kedrion USA, Fort Lee, NJ, USA
Garrett Bergman
Kedrion USA, Fort Lee, NJ, USA
Donald McNeil
Optimed Research, LTD, Columbus, OH, USA
John Hooper
Biocatalyst Research, Lacey, WA, USA
James Moy
Rush University, Chicago, IL, USA
Robert Pesek
Arkansas Children’s Hospital, Little Rock, AR, USA
Julia Upton
The Hospital for Sick Children, Toronto, ON
Ralph Shapiro
Midwest Immunology Clinic, Plymouth, MN, USA
Gordon Sussman
Gordon Sussman Clinical Research Inc., Toronto, ON
Chaim M. Roifman
The Hospital for Sick Children, Toronto, ON

Metrics & Citations

Metrics

Other Metrics

Citations

Cite As

Export Citations

If you have the appropriate software installed, you can download article citation data to the citation manager of your choice. Simply select your manager software from the list below and click Download.

There are no citations for this item

View Options

View options

PDF

View PDF

Get Access

Login options

Check if you access through your login credentials or your institution to get full access on this article.

Subscribe

Click on the button below to subscribe to LymphoSign Journal

Purchase options

Purchase this article to get full access to it.

Restore your content access

Enter your email address to restore your content access:

Note: This functionality works only for purchases done as a guest. If you already have an account, log in to access the content to which you are entitled.

Media

Media

Other

Tables

Share Options

Share

Share the article link

Share on social media